Dogecoin Shows Signs Of Life With Bottoming Signal


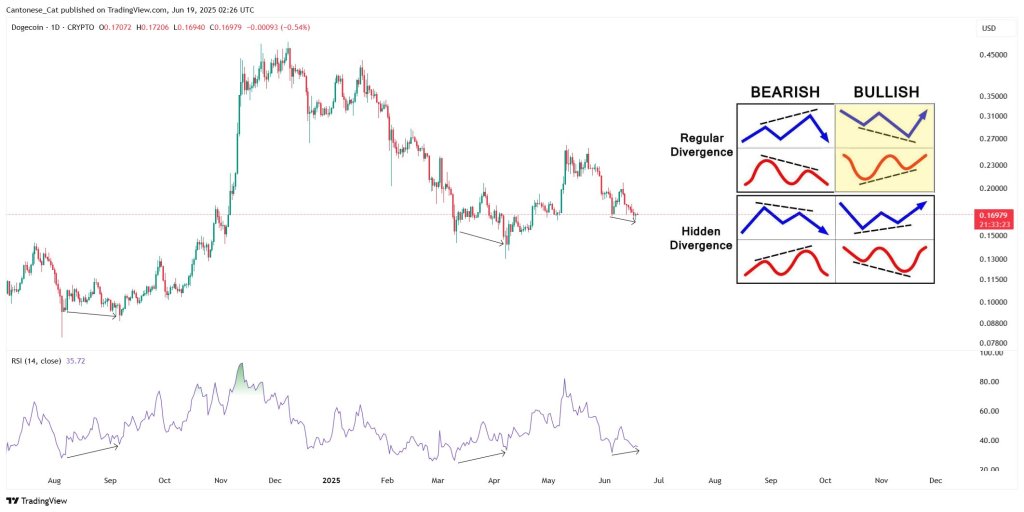
Dogecoin’s daily chart, published by the pseudonymous trader Cantonese Cat on X Wednesday, hints that the meme-coin may be stirring after a months-long down-draft. At 02:26 UTC the TradingView snapshot captured DOGE changing hands at $0.16979, fractionally lower on the session, while the 14-period relative-strength index sat at 35.72, just north of classical oversold territory.
Dogecoin Prints Bullish Divergence
The most striking feature of the graphic is a sequence of regular bullish divergences—price sets progressively lower lows even as the RSI traces higher troughs. Cantonese Cat illustrates three such inflection points: the first in August 2024, the second in March and April 2025 and the latest in mid-June.
Historically, the first signal preceded the parabolic autumn rally that vaulted DOGE from the high-$0.05 area to an intraday peak just shy of $0.23, a nearly 300% advance. The March divergence ushered in a 100 percent rebound back to the $0.26 zone, a former support now acting as overhead resistance.
“DOGE daily – Bullish divergence with RSI,” Cantonese Cat wrote in his post, letting the annotated arrows speak louder than prose. A schematic inserted on the right-hand side of the chart underlines the textbook definition: in the highlighted quadrant, price slopes downward while momentum slopes upward, a configuration often interpreted as buyers quietly absorbing supply.
Descending Channel And Key Support Line
The current structural context lends weight to the signal. Since topping out in November above $0.48, price is retracing inside a descending channel. Within that broader channel, Dogecoin is now retesting a former down-sloping resistance line—which provided stiff resistance throughout March and April this year—that it finally broke in early May and is now acting as crucial support near $0.163.
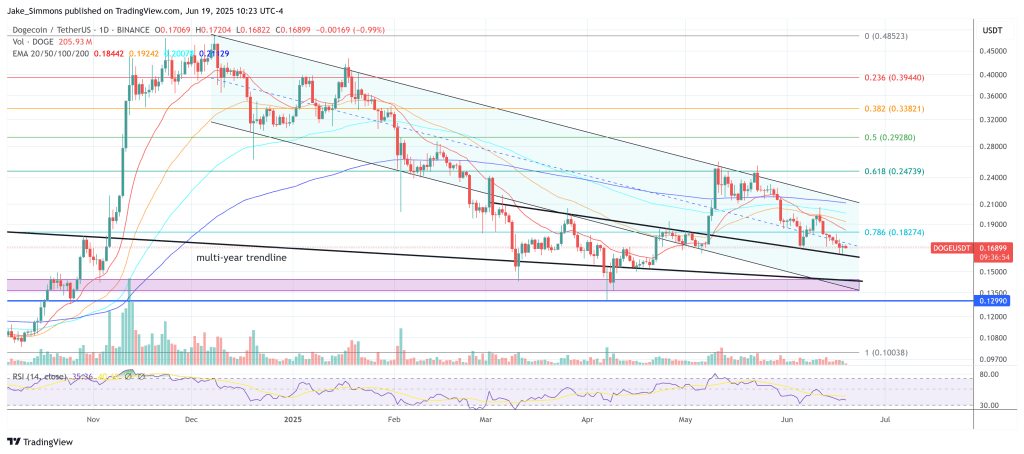
Just below this back-test sits the multi-year ascending trendline which now sits close to $0.142. Should both of those levels falter, the true lower boundary of the descending channel waits a fraction lower around $0.139, giving bulls only a narrow buffer of roughly three cents to defend.
From a Fibonacci perspective, the 0.786 retracement at $0.1826—coupled with the 20- and 50-day exponential moving averages as well as the channel midline at $0.172—forms the first ceiling that must be cleared to shift near-term momentum . A breakout above that area would expose the 0.618 level at $0.247 and the 100-day EMA. Successive hurdles then stack at the 0.5 retracement ($0.292), the 0.382 ($0.338), and the 0.236 ($0.3939), each corresponding to prior congestion zones during the winter advance.
Volume has begun to taper as price approaches support, while the 14-period RSI remains anchored in the mid-30s—still technically oversold, but showing a slight uptick that mirrors the bullish divergence Cantonese Cat flagged. For bears, a decisive daily close beneath the multi-year trendline would invalidate that divergence setup and likely drive DOGE toward the horizontal liquidity band between $0.135 and $0.13, with a final capitulation target around $0.10—site of last October’s base.
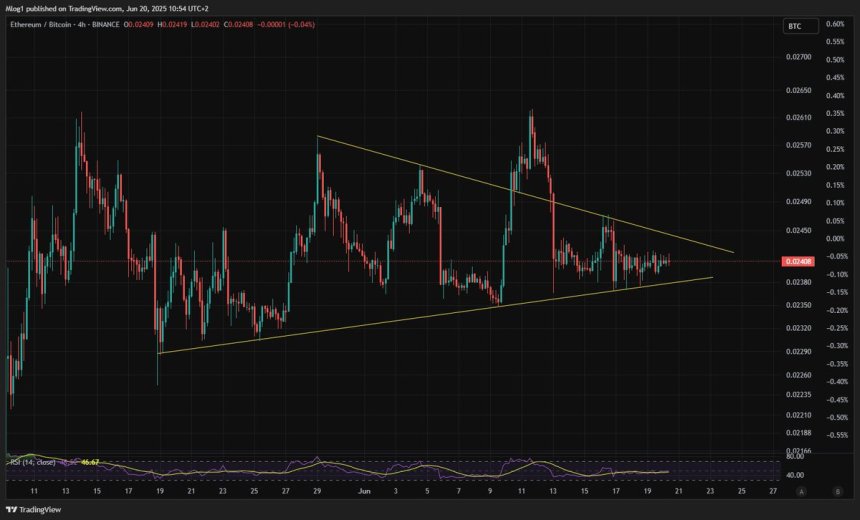
Ethereum Prepares For A Decisive Move: ETH/BTC Setup Could Trigger Altseason
Ethereum is approaching a critical test as price action tightens, setting the stage for a decisive m...
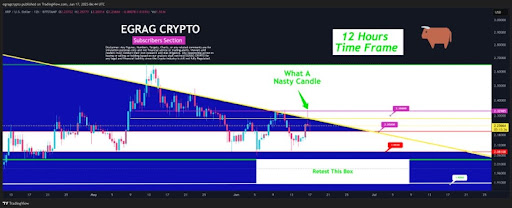
XRP Price In 2026? Pattern From 2017 Reveals How It Will Happen
The XRP price is currently trading well below $3; however, a crypto expert believes that in less tha...
Crypto Analyst Predicts $4 Dogecoin After Exhausted Selling Phase
Dogecoin’s six-month consolidation is a coil, not a coffin, according to the pseudonymous technician...