Bitcoin Price Bottoms Out? Recovery Hopes Rise After Base Formation


Bitcoin price started a fresh decline below the $106,000 zone. BTC is now consolidating and might soon aim for a fresh increase above the $105,500 zone.
- Bitcoin started a fresh decline below the $106,000 zone.
- The price is trading below $105,500 and the 100 hourly Simple moving average.
- There is a key bearish trend line forming with resistance at $104,850 on the hourly chart of the BTC/USD pair (data feed from Kraken).
- The pair could start a fresh increase if it stays above the $103,500 zone.
Bitcoin Price Faces Resistance
Bitcoin price started a fresh decline below the $107,500 zone. BTC gained pace and dipped below the $106,200 and $106,000 levels.
There was a clear move below the $105,000 support level. Finally, the price tested the $103,500 zone. A low was formed at $103,400 and the price started a consolidation phase. It climbed above the 23.6% Fib retracement level of the downward move from the $108,925 swing high to the $103,400 low.
However, the bears were active below the $105,000 zone. Bitcoin is now trading below $105,000 and the 100 hourly Simple moving average . There is also a key bearish trend line forming with resistance at $104,850 on the hourly chart of the BTC/USD pair.
On the upside, immediate resistance is near the $105,000 level. The first key resistance is near the $105,500 level. The next key resistance could be $106,150. It is near the 50% Fib retracement level of the downward move from the $108,925 swing high to the $103,400 low.
A close above the $106,150 resistance might send the price further higher. In the stated case, the price could rise and test the $108,000 resistance level. Any more gains might send the price toward the $108,800 level.
Another Drop In BTC?
If Bitcoin fails to rise above the $105,000 resistance zone, it could start another decline. Immediate support is near the $104,150 level. The first major support is near the $103,500 level.
The next support is now near the $102,500 zone. Any more losses might send the price toward the $101,200 support in the near term. The main support sits at $100,000, below which BTC might gain bearish momentum.
Technical indicators:
Hourly MACD – The MACD is now losing pace in the bearish zone.
Hourly RSI (Relative Strength Index) – The RSI for BTC/USD is now above the 50 level.
Major Support Levels – $104,150, followed by $103,500.
Major Resistance Levels – $105,000 and $106,200.
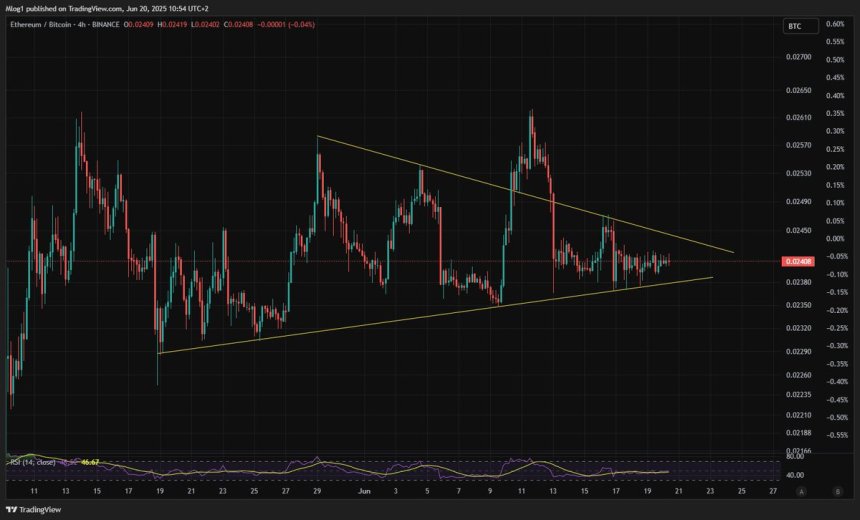
Ethereum Prepares For A Decisive Move: ETH/BTC Setup Could Trigger Altseason
Ethereum is approaching a critical test as price action tightens, setting the stage for a decisive m...
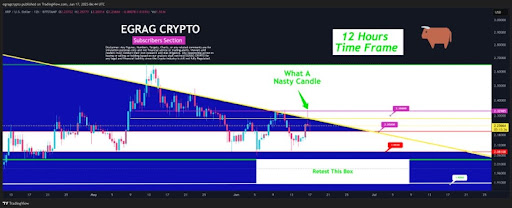
XRP Price In 2026? Pattern From 2017 Reveals How It Will Happen
The XRP price is currently trading well below $3; however, a crypto expert believes that in less tha...
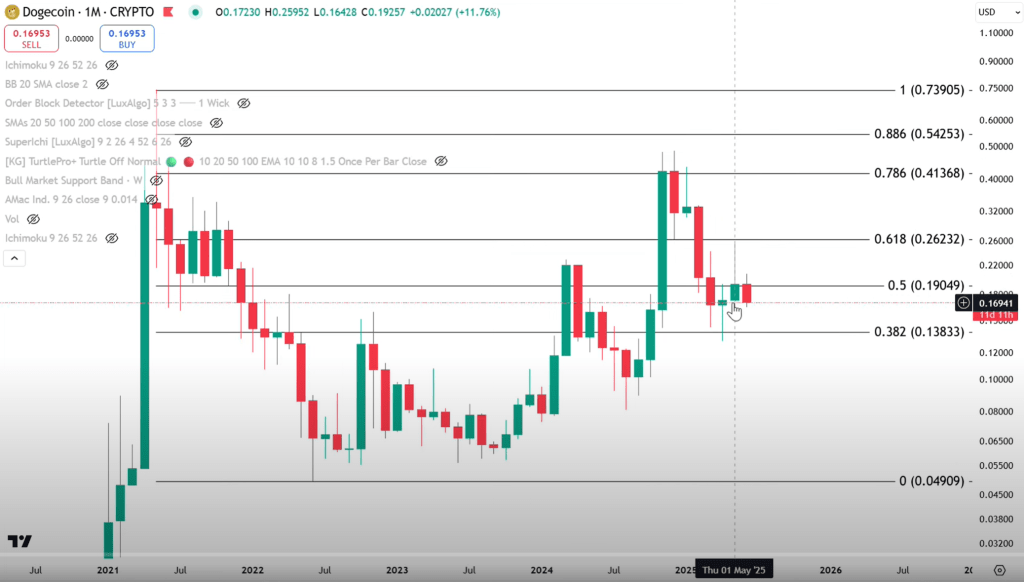
Crypto Analyst Predicts $4 Dogecoin After Exhausted Selling Phase
Dogecoin’s six-month consolidation is a coil, not a coffin, according to the pseudonymous technician...