Solana (SOL) Drops Toward Support — Bulls Eye Potential Recovery Base


Solana failed to stay above $198 and corrected gains. SOL price is now trading below $195 and might find bids near the $188 zone.
- SOL price started a downside correction below $198 against the US Dollar.
- The price is now trading below $195 and the 100-hourly simple moving average.
- There is a declining channel forming with resistance at $200 on the hourly chart of the SOL/USD pair (data source from Kraken).
- The pair could extend losses if it dips below the $188 zone.
Solana Price Approaches Support
Solana price failed to surpass $205 and started a downside correction, beating Bitcoin and Ethereum . SOL dipped below $200 and $198 to enter a short-term bearish zone.
There was a move below the 23.6% Fib retracement level of the upward wave from the $177 swing low to the $205 high. However, the bulls are active near the $192 support. Besides, there is a declining channel forming with resistance at $200 on the hourly chart of the SOL/USD pair.
Solana is now trading below $195 and the 100-hourly simple moving average. On the upside, the price is facing resistance near the $198 level. The next major resistance is near the $200 level. The main resistance could be $205. A successful close above the $205 resistance zone could set the pace for another steady increase. The next key resistance is $220. Any more gains might send the price toward the $225 level.
Downside Break In SOL?
If SOL fails to rise above the $198 resistance, it could start another decline. Initial support on the downside is near the $192 zone and the 50% Fib retracement level of the upward wave from the $177 swing low to the $205 high. The first major support is near the $188 level.
A break below the $188 level might send the price toward the $184 support zone. If there is a close below the $184 support, the price could decline toward the $177 support in the near term.
Technical Indicators
Hourly MACD – The MACD for SOL/USD is gaining pace in the bearish zone.
Hourly Hours RSI (Relative Strength Index) – The RSI for SOL/USD is below the 50 level.
Major Support Levels – $192 and $188.
Major Resistance Levels – $198 and $200.
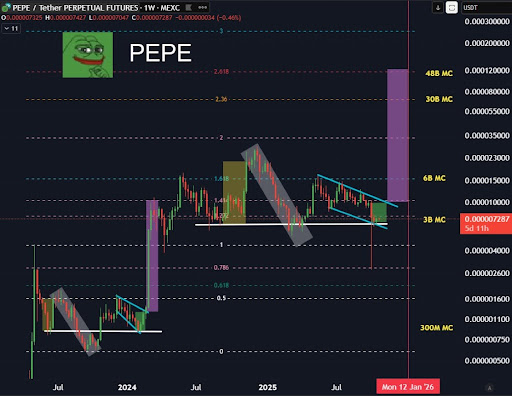
Analyst Predicts 1,500% Rally For The PEPE Price To Reach $0.00012, Here’s When
A fresh wave of bullish optimism has swept across the meme coin community as technical analysts poin...
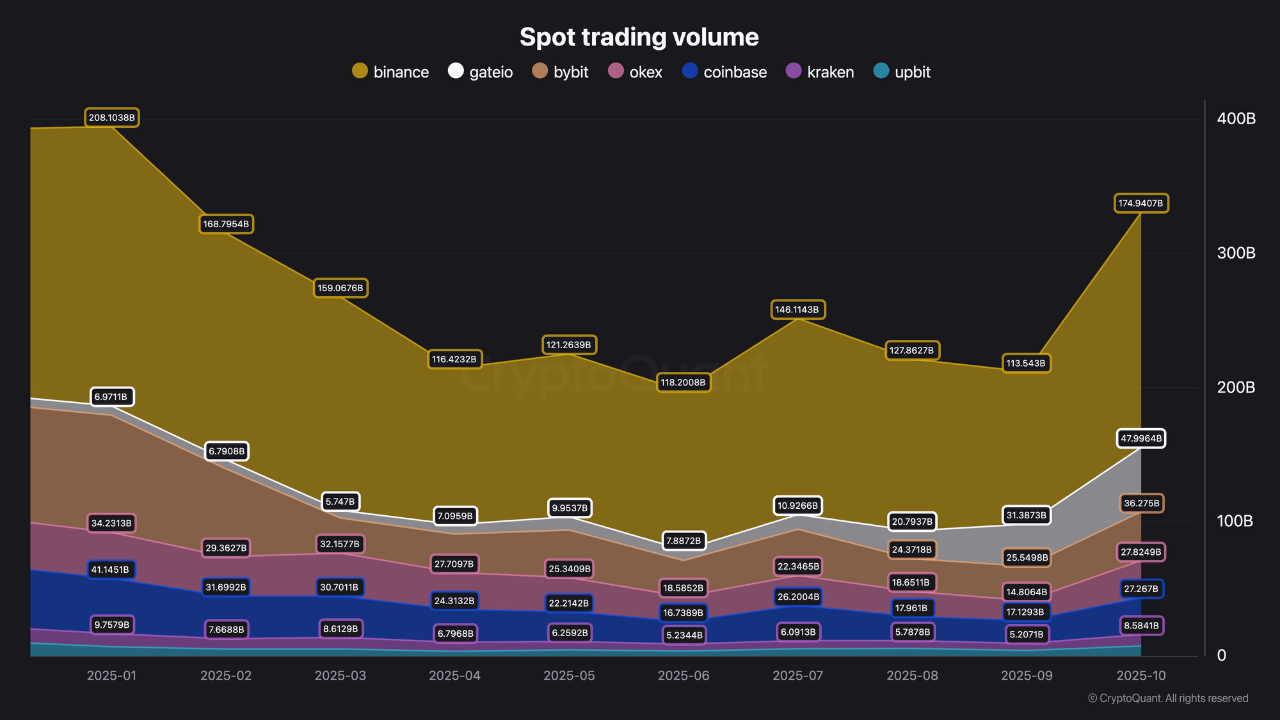
Bitcoin Records Over $300B Spot Volume In October – Investors Shift Away From Leverage
Bitcoin (BTC) has seen heightened volatility following the US Federal Reserve’s decision to cut inte...
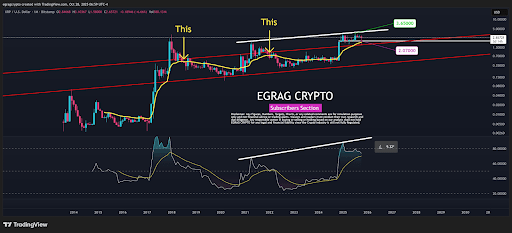
What The XRP RSI Making Higher Highs Means For The Price
A key technical indicator on the XRP price chart is sending an important signal about the strength o...