What The XRP RSI Making Higher Highs Means For The Price


A key technical indicator on the XRP price chart is sending an important signal about the strength of its ongoing price action. The Relative Strength Index (RSI), which measures momentum, is climbing higher in tandem with price, a development that popular XRP analyst EGRAG CRYPTO says validates the current bullish phase.
In one of his recent posts on X , he explained that this alignment between price and RSI shows a healthy uptrend where buying pressure will continue to dominate.
RSI Alignment Shows Healthy Market Momentum
EGRAG CRYPTO highlighted that when both price and RSI make higher highs, it is one of the strongest confirmations that the trend is healthy. He noted that this scenario indicates buyers are firmly in control and that the market is not overextended. According to him, when both price and RSI rise together, the uptrend is real and supported by strength. This is in contrast to bearish divergence, which occurs when price climbs but RSI falls, and is often a precursor to fading momentum and correction.
The RSI data on his chart shows an ascending slope with an angle of about 9.32°, matching XRP’s gradual increase in price over the past year. This synchronized movement implies that the trend is sustainable and supported by genuine market participation instead of temporary hype.
The chart from EGRAG CRYPTO shows that XRP has already broken above the midpoint of its long-term ascending parallel channel. The red trendlines framing the channel stretch back to 2014, and XRP’s breakout above the resistance line shows that bullish momentum is comparable to that of the 2017/2018 rally.
The yellow moving average line, which represents the multi-month trend, is also sloping upward beneath the candles, acting as strong dynamic support. This alignment shows XRP’s improved market structure compared to earlier bear market phases between 2022 and mid-2024.

XRP Price Chart. Source: @egragcrypto On X
What It Means For XRP’s Next Move
EGRAG CRYPTO’s projection identifies $2.07 as the major support level and $3.65 as the near-term target, which aligns with its July 2025 all-time high.
EGRAG CRYPTO’s analysis shows that XRP’s momentum is being confirmed by both price structure and RSI alignment, and this reduces the likelihood of a strong price reversal. The lack of bearish divergence means that the ongoing rally could be setting up for a continuation rather than exhaustion. If XRP sustains its position above the midpoint breakout zone, then a return to $3.65 may follow very soon.
As long as XRP holds above $2.07 and $2.50 for now, the uptrend will stay healthy, and the RSI momentum will support the broader bullish outlook. At the time of writing, XRP is trading at $2.58, having retraced a bit from its intraday high of $2.66. Recent trading sessions have seen the cryptocurrency trying to reclaim $2.60 .

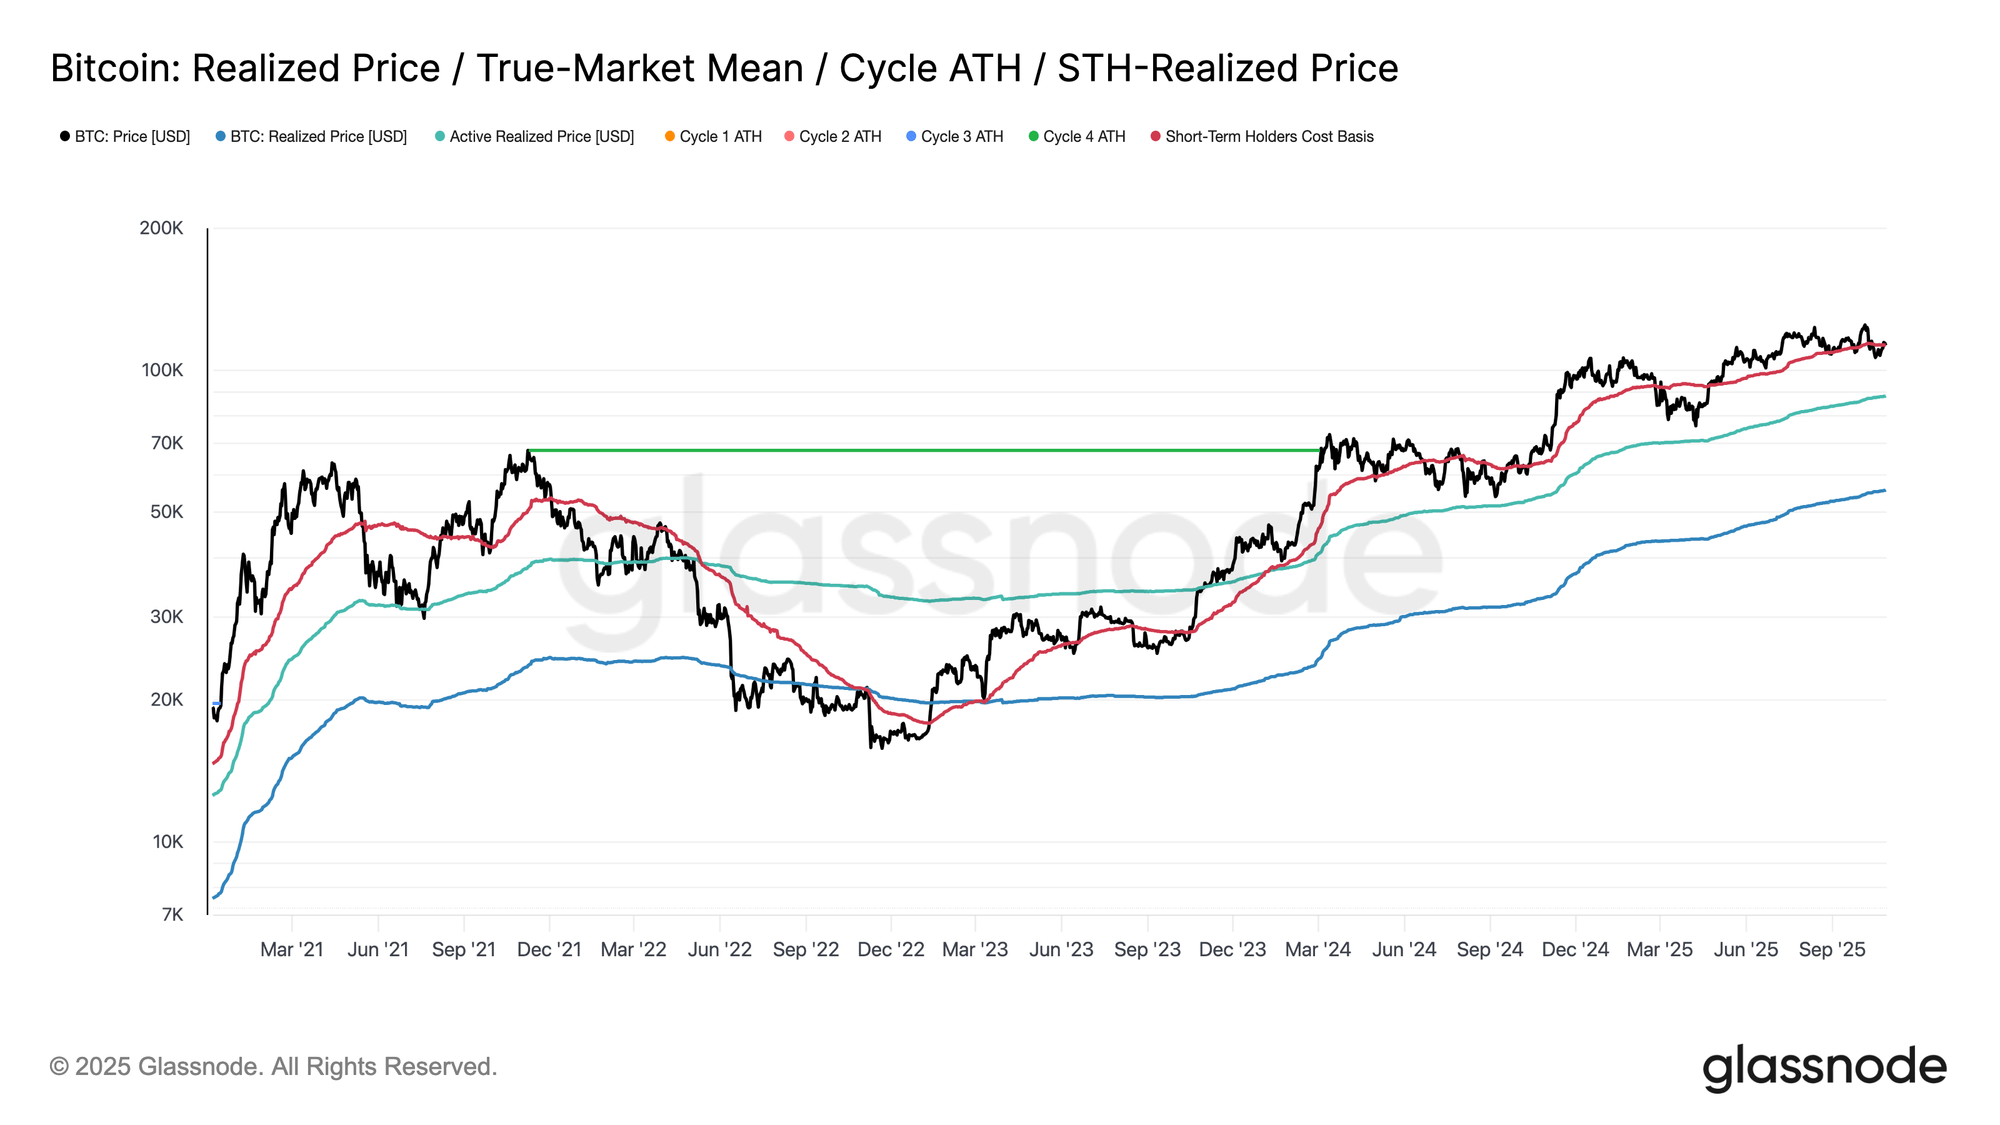
Bitcoin Struggles To Hold Key Support: Could $88,000 Be Next?
Bitcoin has struggled to reclaim the short-term holder Realized Price, a key on-chain level. Here’s ...
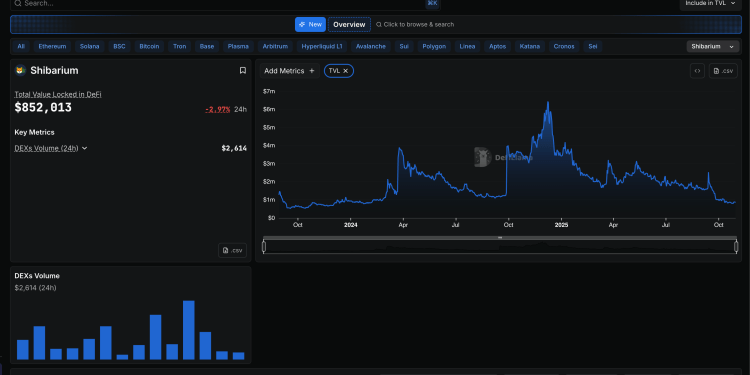
Forget Cardano, Why Shiba Inu’s Shibarium Is The Real Ghost Chain
Shiba Inu’s effort to grow beyond being a meme coin is struggling. Its blockchain network, Shibarium...
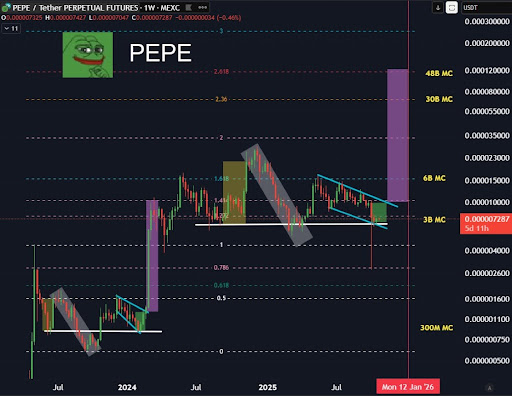
Analyst Predicts 1,500% Rally For The PEPE Price To Reach $0.00012, Here’s When
A fresh wave of bullish optimism has swept across the meme coin community as technical analysts poin...