XRP Price Eyes Key Upside Break – Can Bulls Finally Regain Control?


XRP price started a fresh increase above $2.50. The price is now showing positive signs and could aim for more gains above the $2.620 level.
- XRP price is attempting a recovery wave above the $2.50 zone.
- The price is now trading above $2.50 and the 100-hourly Simple Moving Average.
- There is a key bearish trend line forming with resistance at $2.60 on the hourly chart of the XRP/USD pair (data source from Kraken).
- The pair could start a fresh surge if it clears the $2.60 resistance.
XRP Price Set To Surge?
XRP price found support and started a strong recovery wave above $2.220, like Bitcoin and Ethereum . The price was able to climb above the $2.320 and $2.40 levels to enter a positive zone.
The bulls were able to push the price above the 61.8% Fib retracement level of the downward move from the $3.05 swing high to the $1.40 swing low. However, the bears are still active near the $2.60 and $2.620 levels. Besides, there is a key bearish trend line forming with resistance at $2.60 on the hourly chart of the XRP/USD pair.
The price is now trading above $2.50 and the 100-hourly Simple Moving Average. If there is a fresh upward move, the price might face resistance near the $2.550 level.
The first major resistance is near the $2.60 level and the trend line. The main hurdle could be near the 76.4% Fib retracement level of the downward move from the $3.05 swing high to the $1.40 swing low at $2.660. A clear move above the $2.660 resistance might send the price toward the $2.720 resistance. Any more gains might send the price toward the $2.750 resistance. The next major hurdle for the bulls might be near $2.80.
Another Drop?
If XRP fails to clear the $2.60 resistance zone, it could start a fresh decline. Initial support on the downside is near the $2.50 level. The next major support is near the $2.420 level.
If there is a downside break and a close below the $2.420 level, the price might continue to decline toward $2.320. The next major support sits near the $2.250 zone, below which the price could continue lower toward $2.20.
Technical Indicators
Hourly MACD – The MACD for XRP/USD is now gaining pace in the bullish zone.
Hourly RSI (Relative Strength Index) – The RSI for XRP/USD is now above the 50 level.
Major Support Levels – $2.50 and $2.420.
Major Resistance Levels – $2.60 and $2.660.
Bitcoin Hyper Could Be the Explosive Fix for Bitcoin’s Biggest Problems
What to Know: Bitcoin Hyper has raised over $23.7M in its presale, with tokens priced at $0.013115. ...
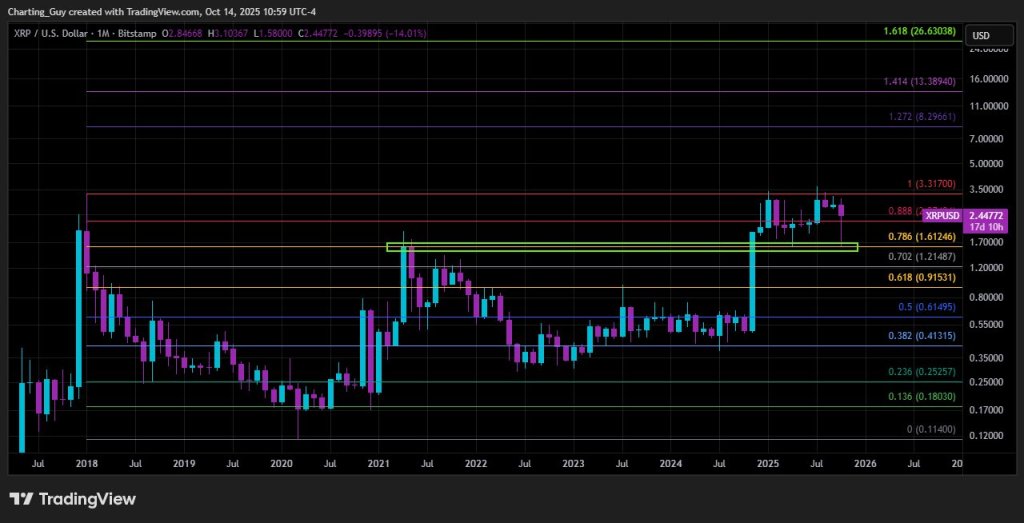
$26 XRP Price Target Remains Technically Valid, Says Expert
The XRP monthly chart remains structurally constructive despite last week’s sharp pullback, accordin...
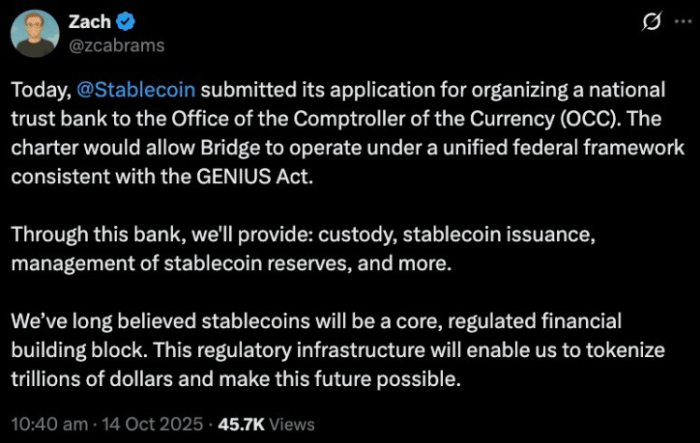
Stripe’s Bridge Leads the Stablecoin Season, and Could Boost Best Wallet Token
What to Know: Stripe’s stablecoin arm, Bridge, has applied for a US national trust bank charter unde...