XRP Price Faces Wall – Recovery Hits Resistance As Market Momentum Fades Again


XRP price started a fresh increase above $2.450. The price is now showing positive signs but faces a major hurdle near the $2.620 level.
- XRP price is attempting a recovery wave above the $2.50 zone.
- The price is now trading above $2.520 and the 100-hourly Simple Moving Average.
- There is a key bearish trend line forming with resistance at $2.650 on the hourly chart of the XRP/USD pair (data source from Kraken).
- The pair could start a fresh decline if it settles below $2.50.
XRP Price Struggles Near Resistance
XRP price found support and started a strong recovery wave above $2.20, like Bitcoin and Ethereum . The price was able to climb above the $2.250 and $2.320 levels to enter a positive zone.
There was a decent increase above the 61.8% Fib retracement level of the downward move from the $3.05 swing high to the $1.40 swing low. However, the price seems to be facing a major barrier near the $2.650 level. Besides, there is a key bearish trend line forming with resistance at $2.650 on the hourly chart of the XRP/USD pair.
The price is now trading above $2.520 and the 100-hourly Simple Moving Average. If there is a fresh upward move, the price might face resistance near the $2.60 level.
The first major resistance is near the $2.650 level and the trend line. It is close to the 76.4% Fib retracement level of the downward move from the $3.05 swing high to the $1.40 swing low. A clear move above the $2.650 resistance might send the price toward the $2.70 resistance. Any more gains might send the price toward the $2.720 resistance. The next major hurdle for the bulls might be near $2.80.
Another Drop?
If XRP fails to clear the $2.650 resistance zone, it could start a fresh decline. Initial support on the downside is near the $2.550 level. The next major support is near the $2.50 level.
If there is a downside break and a close below the $2.50 level, the price might continue to decline toward $2.30. The next major support sits near the $2.2680 zone, below which the price could continue lower toward $2.220.
Technical Indicators
Hourly MACD – The MACD for XRP/USD is now losing pace in the bullish zone.
Hourly RSI (Relative Strength Index) – The RSI for XRP/USD is now near the 50 level.
Major Support Levels – $2.50 and $2.30.
Major Resistance Levels – $2.60 and $2.650.

BNB’s Comeback Meal — Trader Says The Token Ate The Dump For Breakfast
Binance Coin (BNB) climbed to a fresh record on Monday, hitting $1,370 after briefly topping $1,355....
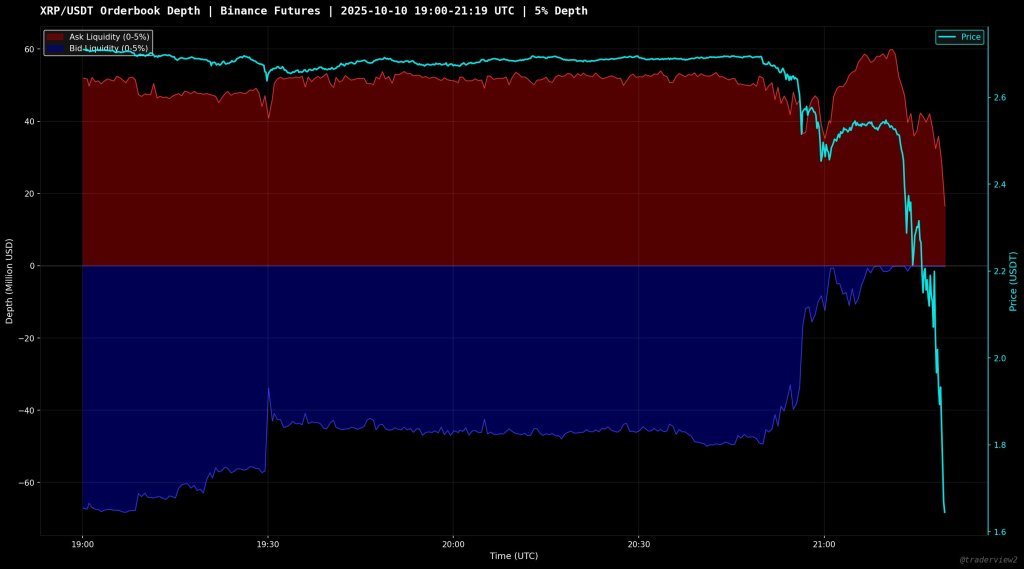
XRP Could Swing To $1.19 Or $20 After Order-Book Collapse, Analyst Warns
In the chaotic aftermath of last week’s market-wide wipeout, one granular forensic stands out: order...

Solana Price Prediction: Analysts Expect $250 Recovery If Bitcoin Regains $120K
The digital asset market is shifting fast, and both Solana and Bitcoin are again in focus. Analysts ...