BNB Price Rally Nears $1,000 – Can Bulls Push Even Higher?


BNB price is gaining pace above the $980 zone. The price is now showing positive signs and might aim for a move above the $1,000 handle in the near term.
- BNB price started a fresh increase above the $950 and $975 levels.
- The price is now trading above $980 and the 100-hourly simple moving average.
- There is a key bullish trend line forming with support at $960 on the hourly chart of the BNB/USD pair (data source from Binance).
- The pair must stay above the $960 level to start another increase in the near term.
BNB Price Hits New ATH
BNB price formed a base above the $900 level and started a fresh increase, beating Ethereum and Bitcoin . There was a steady move above the $940 and $950 levels.
The bulls even cleared the $980 resistance zone. A new all-time high was formed at $995 and the price is now consolidating gains. There was a minor decline and the price tested the 23.6% Fib retracement level of the upward move from the $948 swing low to the $995 high.
The price is now trading above $980 and the 100-hourly simple moving average. Besides, there is a key bullish trend line forming with support at $960 on the hourly chart of the BNB/USD pair.
On the upside, the price could face resistance near the $995 level. The next resistance sits near the $1,000 level. A clear move above the $1,000 zone could send the price higher. In the stated case, BNB price could test $1,050. A close above the $1,050 resistance might set the pace for a larger move toward the $1,120 resistance. Any more gains might call for a test of the $1,150 zone in the near term.
Downside Correction?
If BNB fails to clear the $995 resistance, it could start another decline. Initial support on the downside is near the $980 level. The next major support is near the $970 level or the 50% Fib retracement level of the upward move from the $948 swing low to the $995 high.
The main support sits at $960. If there is a downside break below the $960 support, the price could drop toward the $940 support. Any more losses could initiate a larger decline toward the $920 level.
Technical Indicators
Hourly MACD – The MACD for BNB/USD is gaining pace in the bullish zone.
Hourly RSI (Relative Strength Index) – The RSI for BNB/USD is currently above the 50 level.
Major Support Levels – $970 and $960.
Major Resistance Levels – $995 and $1,000.
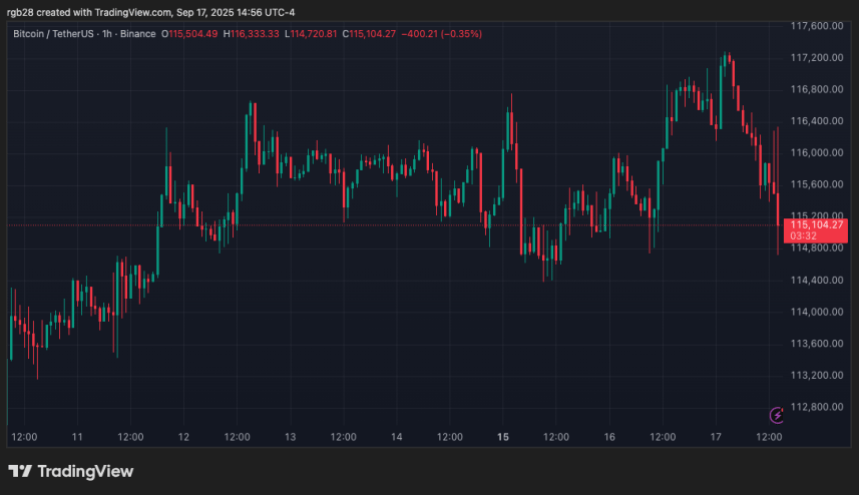
Bitcoin Set Up For ‘Promising’ Q4, Next Two Weeks Could Be Decisive
As the overall market continues to move sideways, Bitcoin (BTC) is attempting to reclaim its local r...

Coinbase Vs. State Regulators: Crypto Exchange Fights Legal Fragmentation
US-based crypto exchange Coinbase has made a significant appeal to the Department of Justice (DOJ) r...
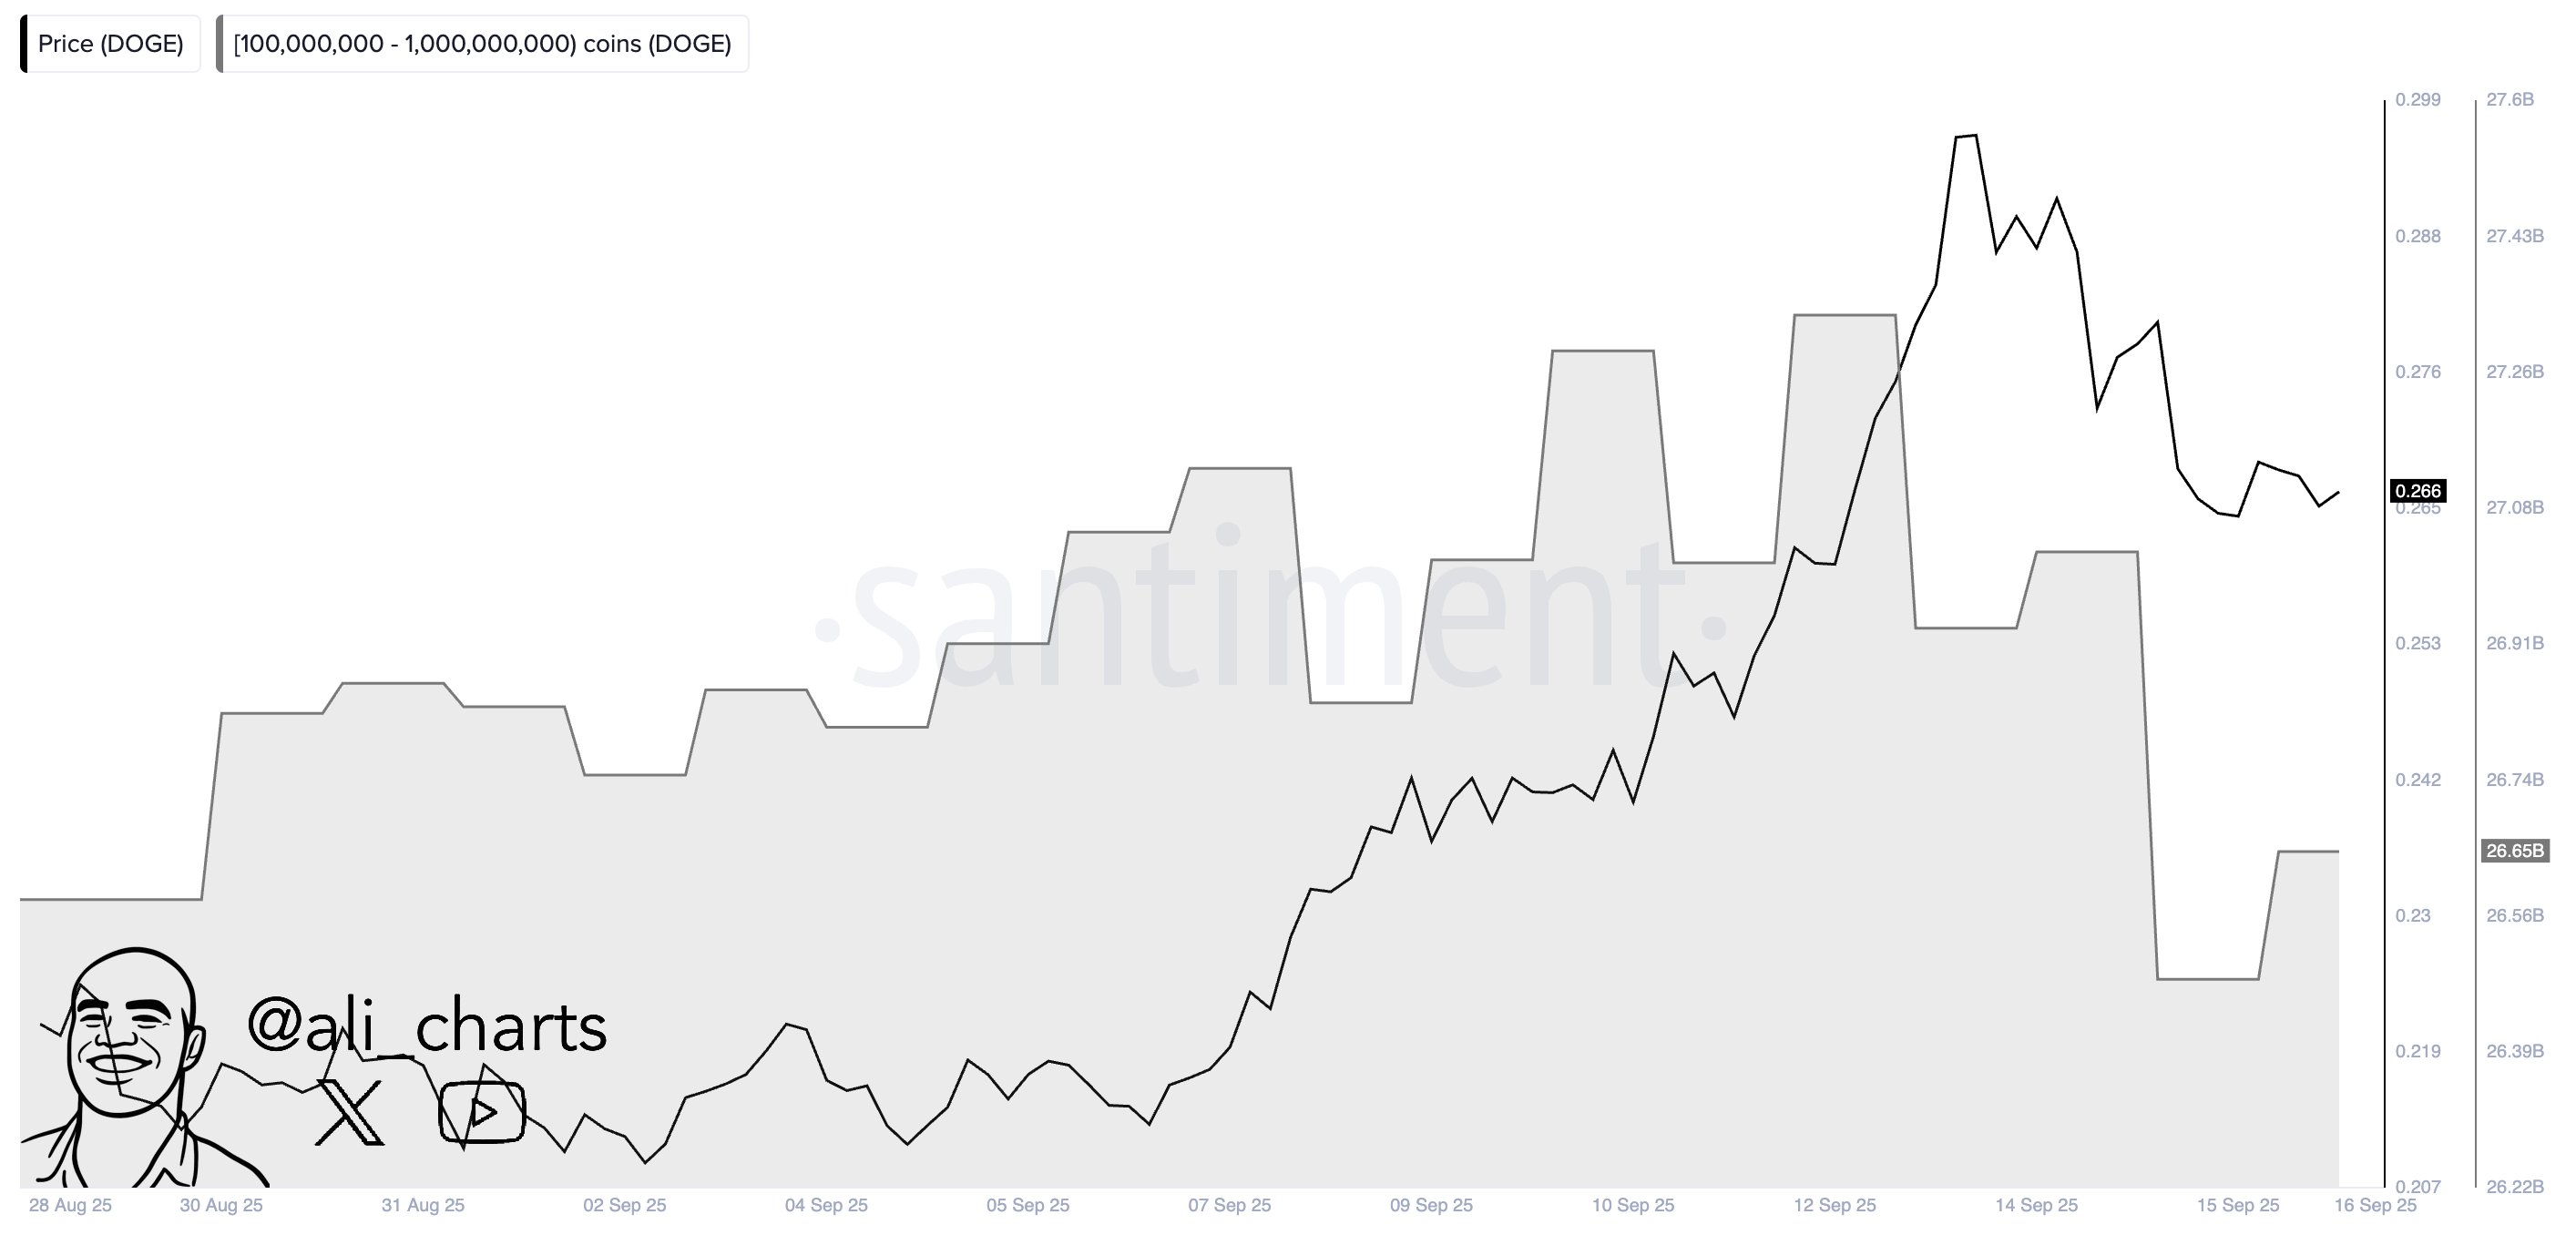
Dogecoin Down 13% As Whales Distribute $181 Million In DOGE
On-chain data shows the Dogecoin whales have gone on a notable selling spree recently, potentially e...