Solana (SOL) Holds Recent Gains – Key Levels Before Another Surge


Solana started a fresh increase above the $240 zone. SOL price is now consolidating gains below $240 and might aim for another increase if it stays above $230.
- SOL price started a fresh upward move above the $240 and $242 levels against the US Dollar.
- The price is now trading below $240 and the 100-hourly simple moving average.
- There is a key bearish trend line forming with resistance at $238 on the hourly chart of the SOL/USD pair (data source from Kraken).
- The pair could extend losses if it dips below the $230 zone.
Solana Price Consolidates Gains
Solana price started a decent increase after it settled above the $220 zone, beating Bitcoin and Ethereum . SOL climbed above the $235 level to enter a short-term positive zone.
The price even smashed the $242 resistance. The bulls were able to push the price above the $245 barrier. A high was formed at $250 and the price recently started a downside correction. There was a move below the 23.6% Fib retracement level of the upward wave from the $200 swing low to the $250 high.
However, the bulls were active above $230. Solana is now trading below $240 and the 100-hourly simple moving average. On the upside, the price is facing resistance near the $238 level. Besides, there is a key bearish trend line forming with resistance at $238 on the hourly chart of the SOL/USD pair.
The next major resistance is near the $242 level. The main resistance could be $250. A successful close above the $250 resistance zone could set the pace for another steady increase. The next key resistance is $262. Any more gains might send the price toward the $280 level.
More Downside In SOL?
If SOL fails to rise above the $238 resistance, it could start another decline. Initial support on the downside is near the $232 zone. The first major support is near the $229 level or the 50% Fib retracement level of the upward wave from the $200 swing low to the $250 high.
A break below the $229 level might send the price toward the $220 support zone. If there is a close below the $220 support, the price could decline toward the $212 support in the near term.
Technical Indicators
Hourly MACD – The MACD for SOL/USD is losing pace in the bullish zone.
Hourly Hours RSI (Relative Strength Index) – The RSI for SOL/USD is below the 50 level.
Major Support Levels – $229 and $220.
Major Resistance Levels – $238 and $250.
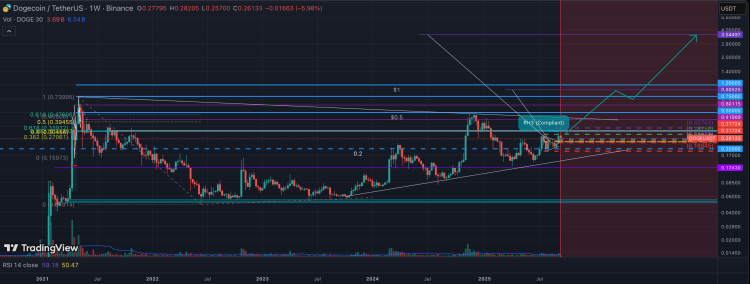
Dogecoin Price Eyes 1,250% Surge To $3.5 – Here’s The Roadmap
The Dogecoin price recorded one of the most notable recoveries over the weekend, rising by more than...
Viral Meme Coin Pudgy Pandas Sparks Maxi Doge Presale to Soar Beyond $2M
A new meme coin from China, Pudgy Pandas ($PANDA), raised over $300K in one day on presale, gaining ...

Citi’s Ethereum Forecast: No New All-Time High Expected, Year-End Target At $4,300
Following an all-time high (ATH) reached last August, Ethereum (ETH), the market’s second-largest cr...