Bitcoin Price Back at Resistance – Fed Meeting Could Trigger Big Move


Bitcoin price is moving higher above $116,200. BTC is now consolidating and might gain bullish momentum if it clears the $116,850 resistance zone.
- Bitcoin started a fresh increase above the $116,000 zone.
- The price is trading below $116,000 and the 100 hourly Simple moving average.
- There was a break above a contracting triangle with resistance at $115,750 on the hourly chart of the BTC/USD pair (data feed from Kraken).
- The pair might start another increase if it clears the $116,850 zone.
Bitcoin Price Hits Resistance
Bitcoin price started a fresh upward wave above the $114,500 zone. BTC managed to climb above the $115,000 and $115,500 resistance levels.
The bulls were able to push the price above $116,200 and $116,500. Besides, there was a break above a contracting triangle with resistance at $115,750 on the hourly chart of the BTC/USD pair. The price traded as high as $116,959 and is currently consolidating gains. It is stable above the 23.6% Fib retracement level of the recent move from the $114,156 swing low to the $116,959 high.
Bitcoin is now trading above $116,000 and the 100 hourly Simple moving average. Immediate resistance on the upside is near the $116,850 level. The first key resistance is near the $117,200 level.
The next resistance could be $117,500. A close above the $117,500 resistance might send the price further higher. In the stated case, the price could rise and test the $118,400 resistance level. Any more gains might send the price toward the $118,800 level. The next barrier for the bulls could be $119,250.
Another Decline In BTC?
If Bitcoin fails to rise above the $116,850 resistance zone, it could start a fresh decline. Immediate support is near the $116,250 level. The first major support is near the $115,550 level or the 50% Fib retracement level of the recent move from the $114,156 swing low to the $116,959 high.
The next support is now near the $115,200 zone. Any more losses might send the price toward the $114,500 support in the near term. The main support sits at $112,500, below which BTC might decline heavily.
Technical indicators:
Hourly MACD – The MACD is now gaining pace in the bullish zone.
Hourly RSI (Relative Strength Index) – The RSI for BTC/USD is now above the 50 level.
Major Support Levels – $115,550, followed by $115,200.
Major Resistance Levels – $116,850 and $117,200.
Viral Meme Coin Pudgy Pandas Sparks Maxi Doge Presale to Soar Beyond $2M
A new meme coin from China, Pudgy Pandas ($PANDA), raised over $300K in one day on presale, gaining ...

Citi’s Ethereum Forecast: No New All-Time High Expected, Year-End Target At $4,300
Following an all-time high (ATH) reached last August, Ethereum (ETH), the market’s second-largest cr...
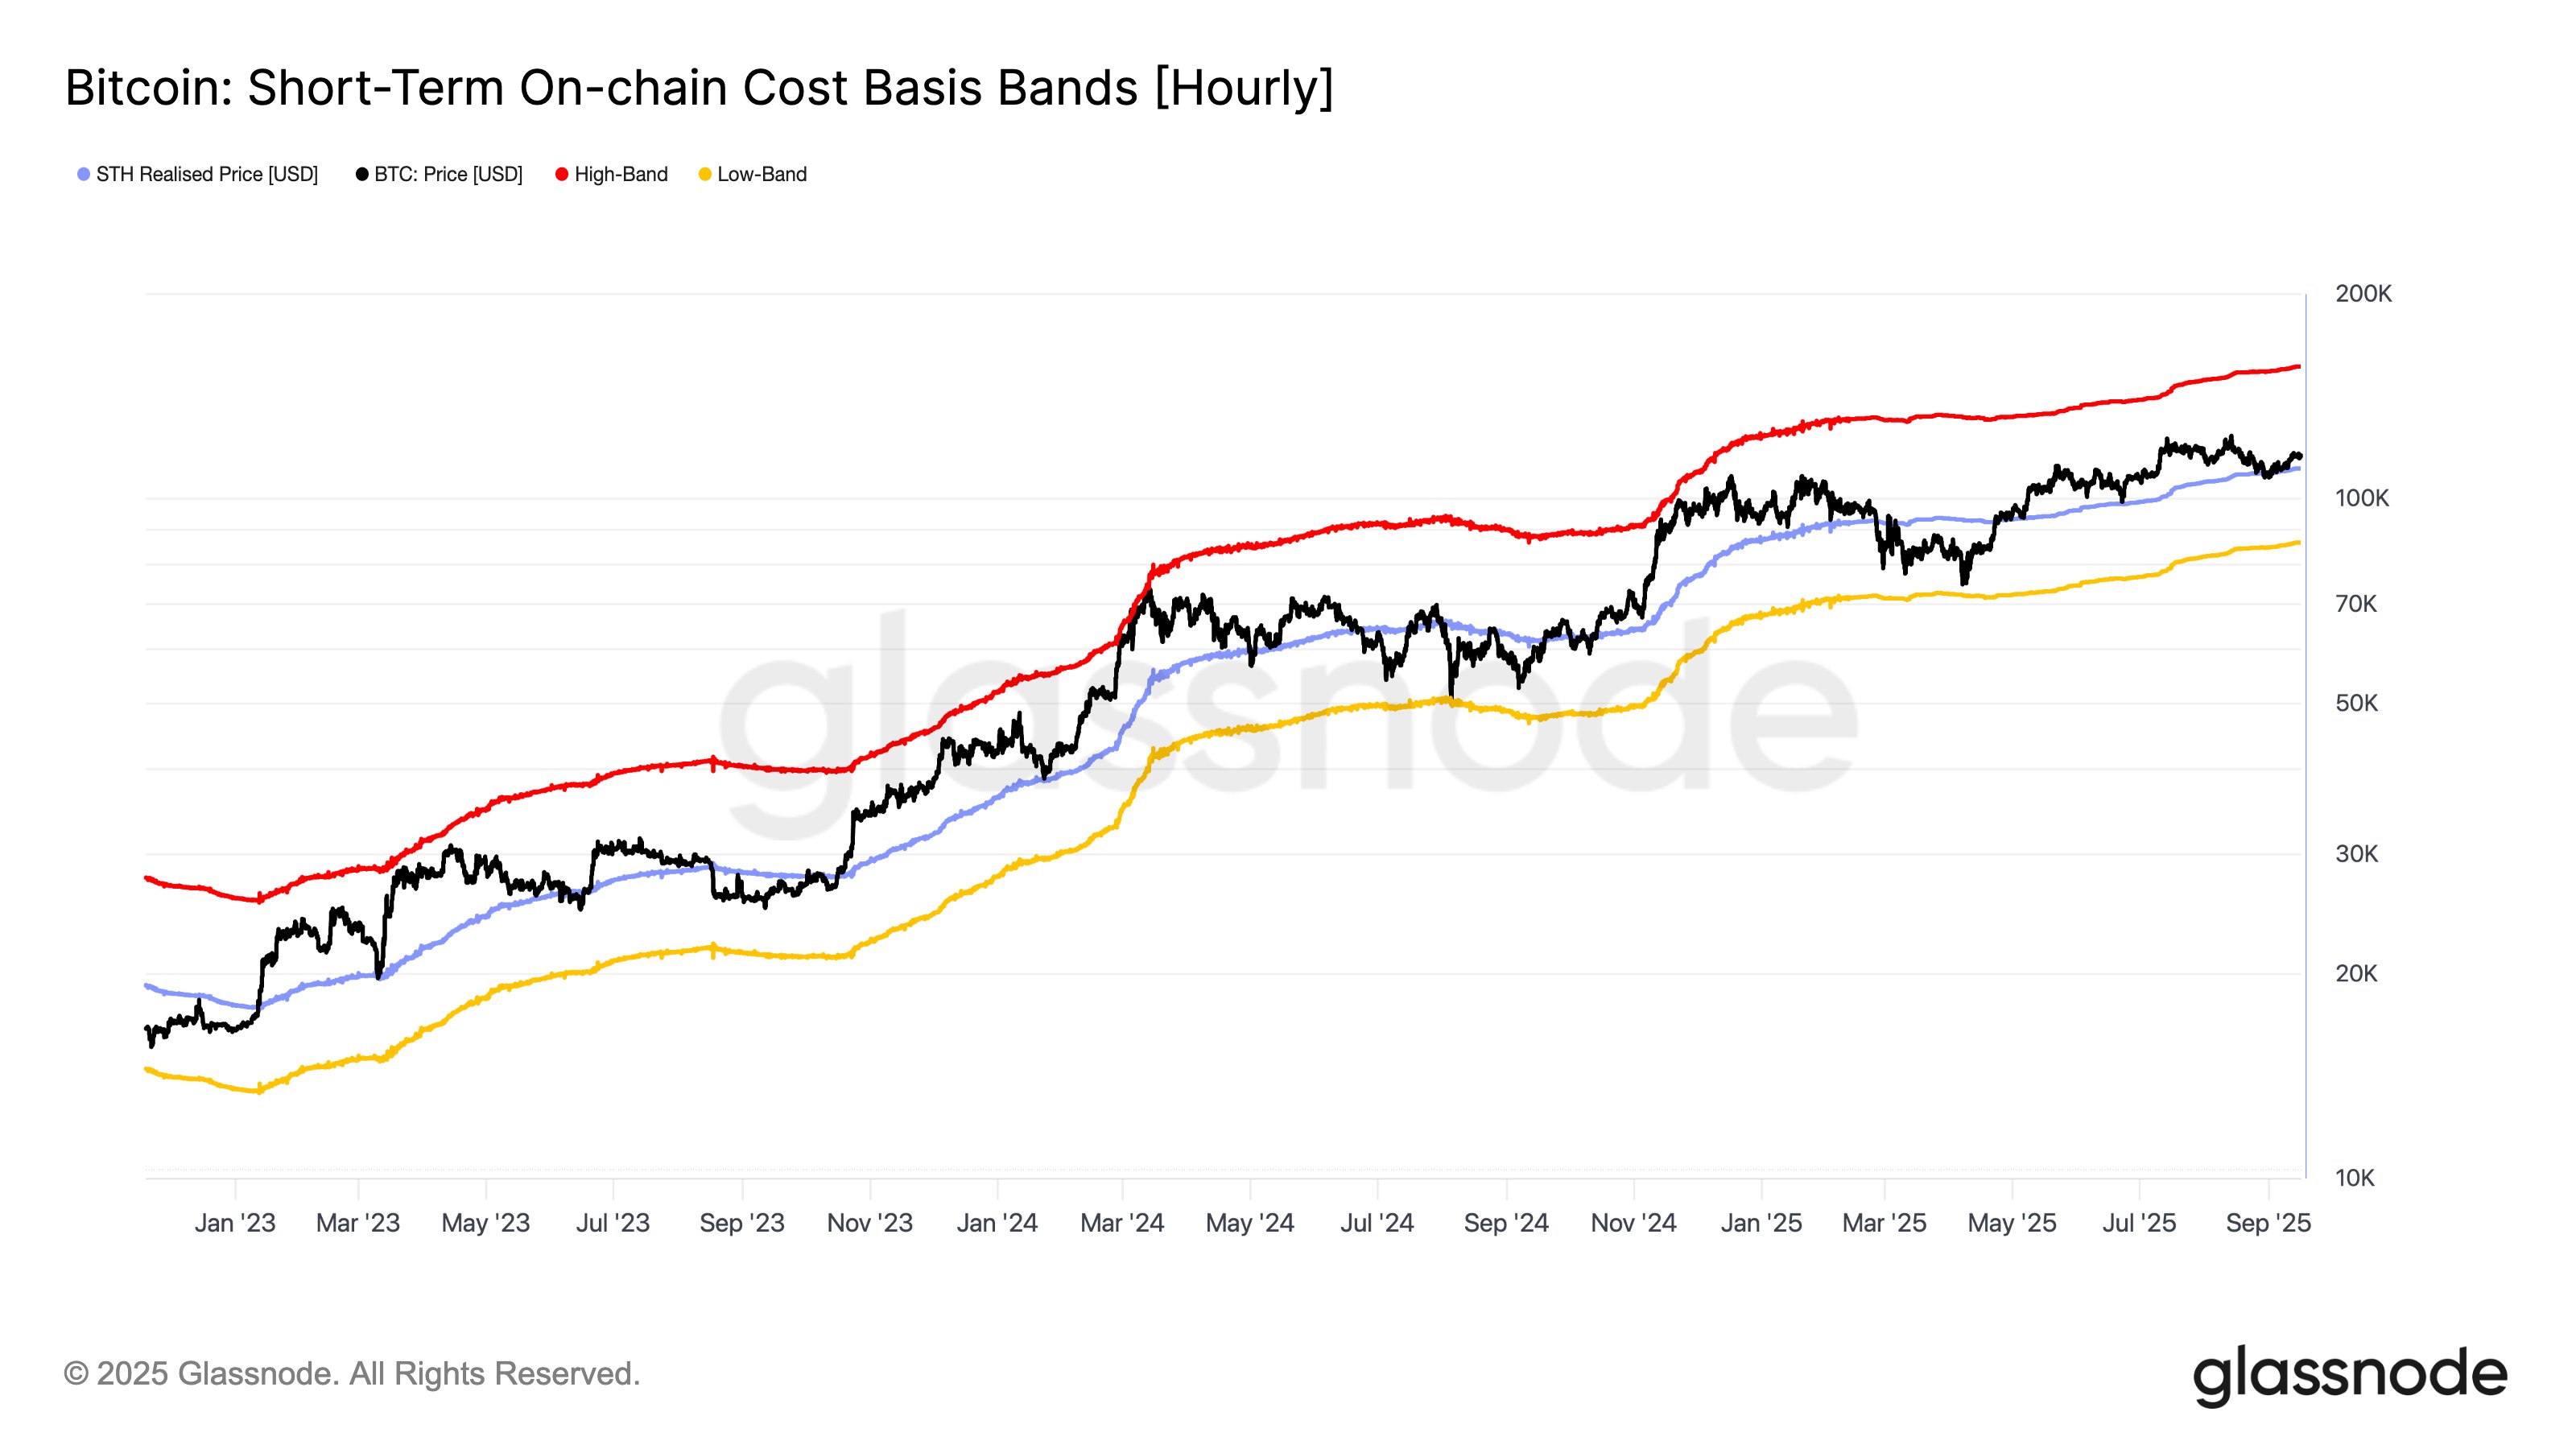
Bitcoin Trend Constructive As Long As This Metric Holds, Glassnode Says
On-chain analytics firm Glassnode has explained how the Bitcoin price trend remains constructive as ...