BNB Price Struggles Below $850 – Is Momentum Fading Fast?


BNB price is consolidating losses below the $850 zone. The price is now facing hurdles near $855 and might start another decline in the near term.
- BNB price is correcting gains and traded below the $855 support zone.
- The price is now trading below $850 and the 100-hourly simple moving average.
- There is a short-term contracting triangle forming with support at $845 on the hourly chart of the BNB/USD pair (data source from Binance).
- The pair must stay above the $840 level to start another increase in the near term.
BNB Price Dips To Support
After a steady increase, BNB price failed to clear the $868 zone. There was a downside correction below the $865 and $855 levels, like Ethereum and Bitcoin .
The price even dipped below $850 and tested $842. A low was formed at $842 and the price is now attempting a fresh increase. There was a move above the 23.6% Fib retracement level of the downward move from the $864 swing high to the $842 low.
The price is now trading below $850 and the 100-hourly simple moving average. Besides, there is a short-term contracting triangle forming with support at $845 on the hourly chart of the BNB/USD pair.
On the upside, the price could face resistance near the $850 level. The next resistance sits near the $855 level and the 61.8% Fib retracement level of the downward move from the $864 swing high to the $842 low. A clear move above the $855 zone could send the price higher.
In the stated case, BNB price could test $865. A close above the $865 resistance might set the pace for a larger move toward the $880 resistance. Any more gains might call for a test of the $888 level in the near term.
Another Decline?
If BNB fails to clear the $855 resistance, it could start another decline. Initial support on the downside is near the $845 level. The next major support is near the $842 level.
The main support sits at $835. If there is a downside break below the $835 support, the price could drop toward the $820 support. Any more losses could initiate a larger decline toward the $800 level.
Technical Indicators
Hourly MACD – The MACD for BNB/USD is losing pace in the bullish zone.
Hourly RSI (Relative Strength Index) – The RSI for BNB/USD is currently below the 50 level.
Major Support Levels – $842 and $835.
Major Resistance Levels – $855 and $865.
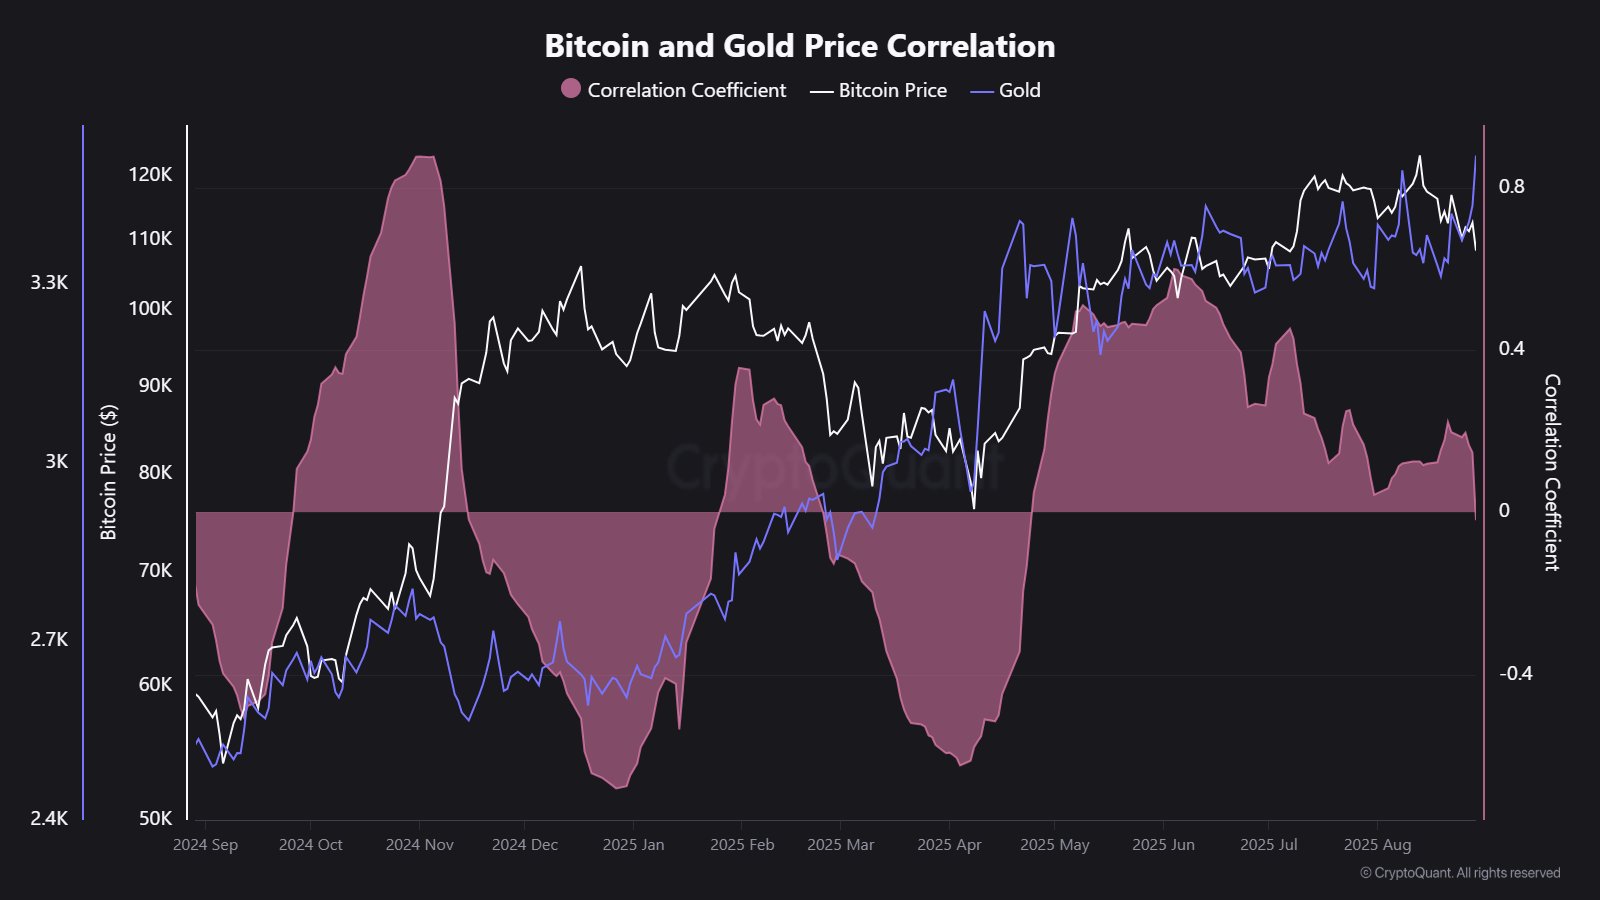
Safe Haven Split: Bitcoin-Gold Correlation Turns Negative For First Time In 6 Months
Data shows the correlation between Bitcoin and Gold has turned negative, a sign that the two assets ...

Stripe And Paradigm Announce Tempo, A New Layer-1 Blockchain For Stablecoins
Fintech giant Stripe and crypto venture firm Paradigm have announced their collaboration on a new pr...
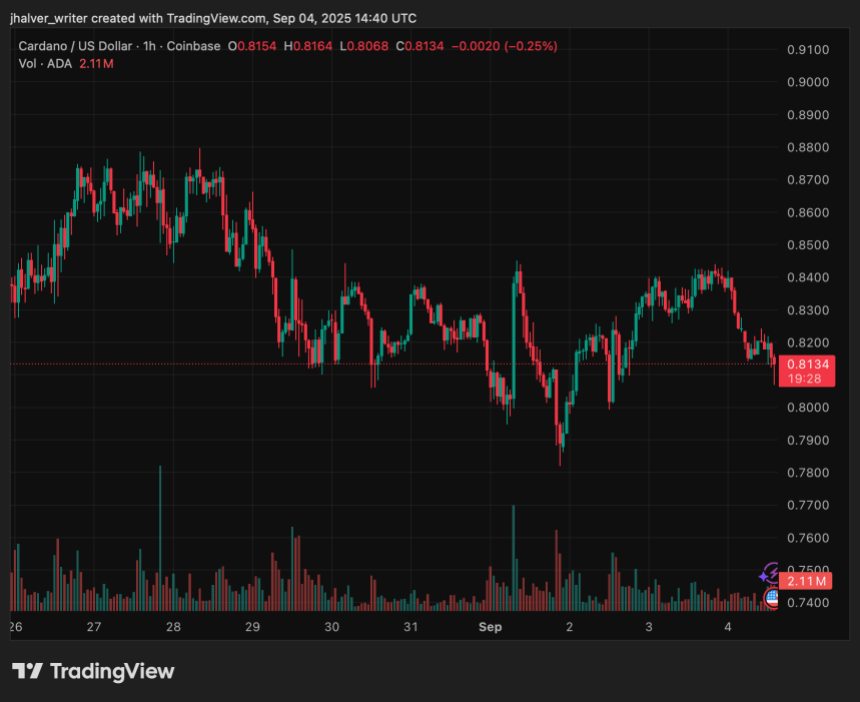
Cardano Price Prediction: ADA Bears Test Support, Bulls Eye $0.92 Breakout on Hoskinson Boost
Cardano (ADA) has entered September with mixed signals. On-chain data from Santiment reveals that re...