$160K Bitcoin By Christmas? Analysts Say It’s Still Possible


Bitcoin slid to levels not seen since early July this week, but some analysts say the drop may be only a short pause before a bigger year-end move.
September has a long record of being the weakest month for BTC , and historically it has never closed more than 8% higher. That context is shaping how traders and researchers read the charts now.
Expert’s Timing And Historic Averages
According to research from network economist Timothy Peterson, there are four months until Christmas and history favors gains in that window.
Peterson posted on X that Bitcoin has been higher over the same four-month span 70% of the time, and the average gain he calculated was +44%.
Based on that average, Bitcoin would trade near $160,000 by the last week of 2025. Peterson also warned that the calculation is more of a guideline than a promise.
Exactly Four Months Until Christmas. How does Bitcoin fare during this time?
Up 70% of the time. Average gain +44%.
However I think some years do not have market/economic conditions comparable to 2025. I would exclude 2018, 2022, 2020, and 2017 as uncharacteristic years.… pic.twitter.com/0llPeTrilC
— Timothy Peterson (@nsquaredvalue) August 25, 2025
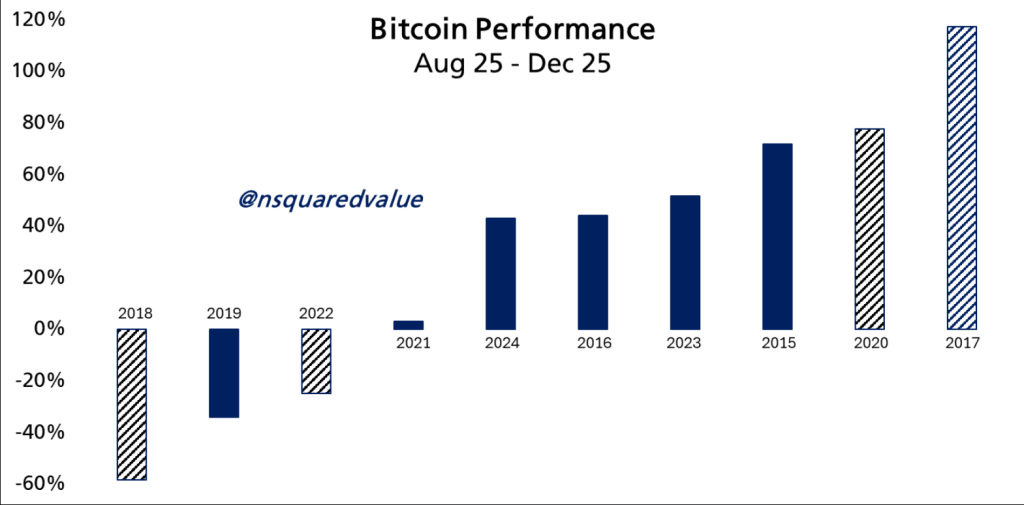
He suggested excluding certain years—2018, 2022, 2020, and 2017—because those years did not match what he calls comparable market conditions, and removing them tilts the result toward steadier, more positive returns.
Markets rarely follow neat averages. Even when a long-term pattern appears, short bursts of volatility still happen.
Peterson’s note about excluding specific years acknowledges that reality. It is a reminder that averages smooth over big swings.
BTC…

We’re just front-running the “September sell off”.
The scale is different — but the outcome is the same.
Much higher. pic.twitter.com/3oZqRlrtgv
— Donny (@DonnyDicey) August 27, 2025
Traders See Familiar Patterns
Some traders on X described the current price behavior as a repeat of past seasonal moves. According to Trader Donny, Bitcoin is “front-running” the usual September lull and could move significantly higher afterward.
He compared the present action to 2017 and suggested that BTC might be mirroring gold , catching up after a period of lag.
That comparison to gold has been made before; it is a shorthand for assets that sometimes trade out of sync and then align again as macro forces change. For now, price action looks like a pause, not a breakdown.
 Outlook Through Year End
Based on reports and the numbers involved, the coming months will be an important test of whether past four-month rallies repeat themselves.
An average +44% move would be a big swing if it materializes, yet averages do not guarantee one outcome.
For traders and investors, that means balancing the historical pattern with the real-time risks that have pushed BTC back to July levels.
Featured image from Meta, chart from TradingView
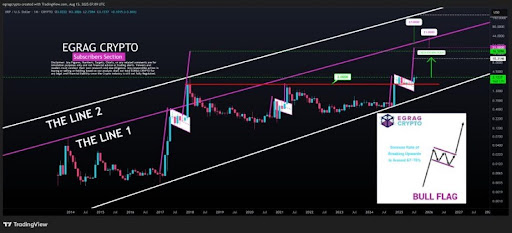
XRP Price To Rally 5,600% To $200? Crypto Analyst Lays Out The Possibilities
Crypto analyst Egrag Crypto has raised the possibility of the XRP price rallying to $200. This follo...
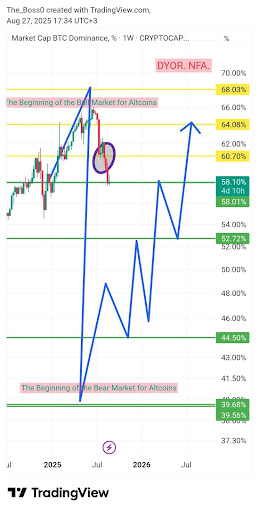
Bounce Or Breakdown? Bitcoin Dominance Tests Critical Technical Levels
Bitcoin dominance is at a pivotal moment, testing key support levels that could determine market dir...
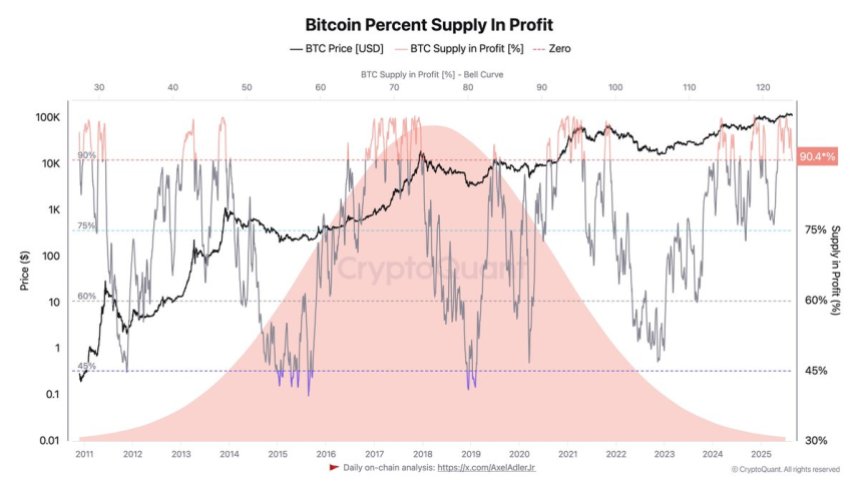
Bitcoin Supply In Profit Hits Historical Threshold – Echoing Past Patterns
Bitcoin is currently consolidating within a narrow range, trading below the $115,000 level while hol...