XRP Price Holding Weak Below $3.10, Bears Maintain Their Edge


XRP price is gaining bearish pace below the $3.10 resistance zone. The price is struggling near $3.050 and remains at risk of more losses.
- XRP price is declining below the $3.150 and $3.10 levels.
- The price is now trading below $3.10 and the 100-hourly Simple Moving Average.
- There is a bearish trend line forming with resistance at $3.070 on the hourly chart of the XRP/USD pair (data source from Kraken).
- The pair could regain bullish momentum if it clears the $3.120 zone.
XRP Price Dips Further
XRP price remained in a bearish zone after a close below the $3.20 level, like Bitcoin and Ethereum . The price extended losses and traded below the $3.10 support zone.
The price even declined below $3.00. Finally, it tested the $2.950 support zone. A low was formed at $2.941 and the price recently attempted a recovery wave above the 50% Fib retracement level of the downward move from the $3.148 swing high to the $2.941 low.
However, the bears were active near $3.10 and the 76.4% Fib retracement level of the downward move from the $3.148 swing high to the $2.941 low. There is also a bearish trend line forming with resistance at $3.070 on the hourly chart of the XRP/USD pair.
The price is now trading below $3.050 and the 100-hourly Simple Moving Average. On the upside, the price might face resistance near the $3.0450 level. The first major resistance is near the $3.070 level.
A clear move above the $3.070 resistance might send the price toward the $3.120 resistance. Any more gains might send the price toward the $3.150 resistance or the 50% Fib retracement level of the downward move from the $3.350 swing high to the $2.97 low. The next major hurdle for the bulls might be near $3.20.
More Losses?
If XRP fails to clear the $3.070 resistance zone, it could start a fresh decline. Initial support on the downside is near the $2.9420 level. The next major support is near the $2.920 level.
If there is a downside break and a close below the $2.920 level, the price might continue to decline toward the $2.850 support. The next major support sits near the $2.80 zone, below which there could be a larger decline.
Technical Indicators
Hourly MACD – The MACD for XRP/USD is now gaining pace in the bearish zone.
Hourly RSI (Relative Strength Index) – The RSI for XRP/USD is now below the 50 level.
Major Support Levels – $2.940 and $2.880.
Major Resistance Levels – $3.070 and $3.10.
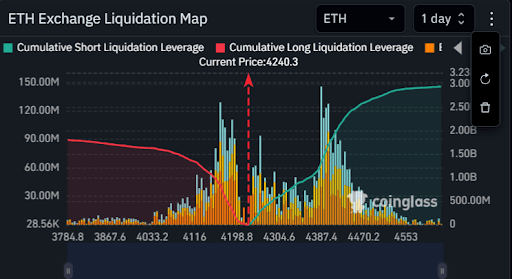
Ethereum Price Crash: $2 Billion In Losses Is Waiting For Traders At This Level
Up to $2 billion in long positions face liquidation amid this Ethereum price crash. These positions ...
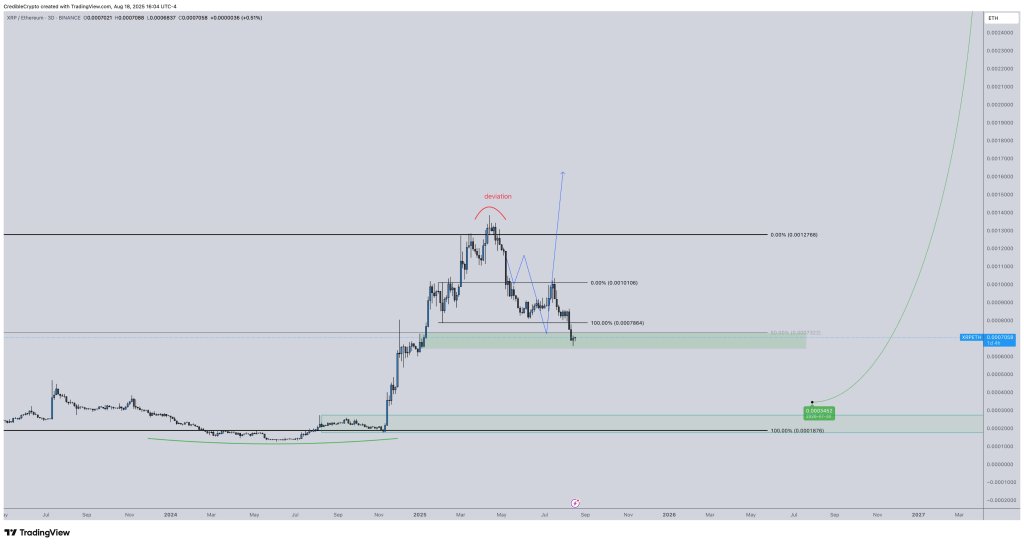
XRP About To Leave Ethereum In The Dust—Move Imminent, Analyst Warns
CrediBULL Crypto (@CredibleCrypto) argues that market structure across three charts—XRP/ETH, XRP/USD...
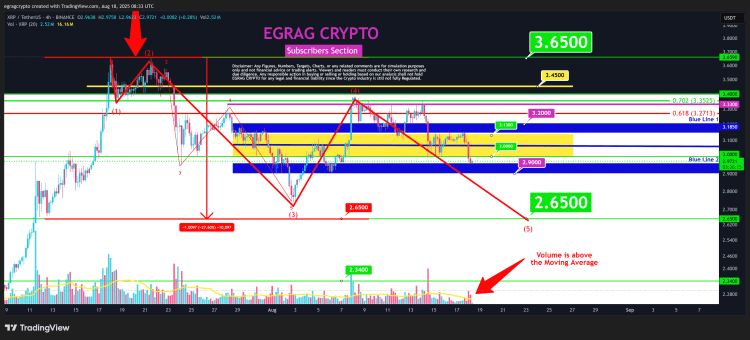
Key Levels To Watch In Light Of XRP’s Macro Future
With XRP staring down the barrel of bears, there are now a number of levels that are important to wa...