Bitcoin Faces Make-Or-Break Moment In September – Here’s Why


Bitcoin prices have now crashed by over 4% after reaching a new all-time high on August 14. The crypto market leader remains in consolidation, potentially gathering momentum for the next leg up. Amidst this stable market structure, a popular trading expert with the X username KillaXBT provides insights into possible price developments for the next month.
CRT Model Flags September As Pivotal For Bitcoin’s Bull Cycle
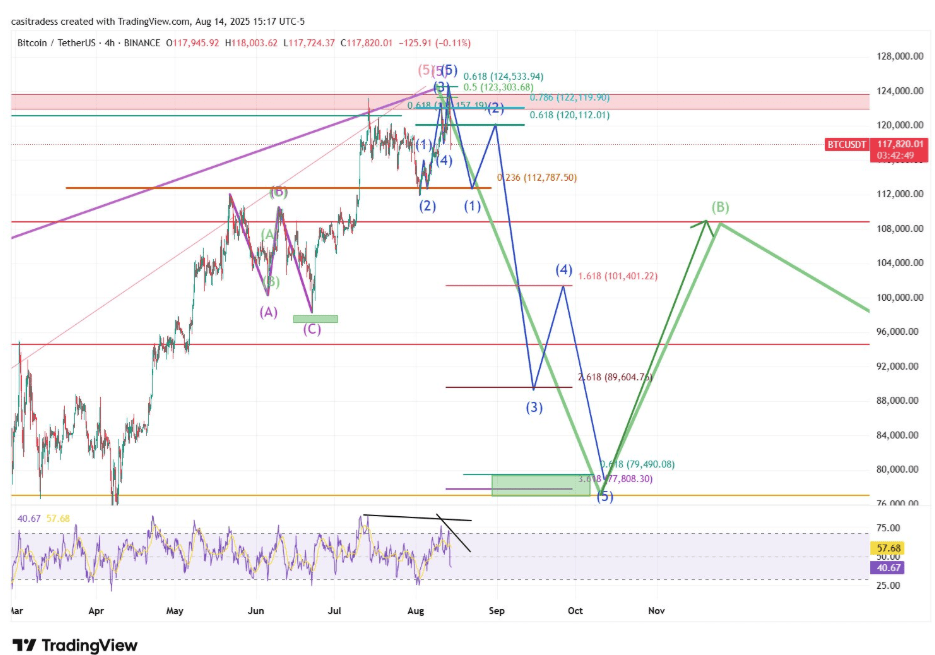
In an X post on August 15, KillaXBT outlines potential BTC price trajectories via in-depth technical analysis of the monthly chart. Using the candle range theory (CRT), the renowned analyst postulates that the premier cryptocurrency would be entering a pivotal month in September during which it could produce a cycle top. Looking at the asset’s performance in August, KillaXBT notes that Bitcoin formed a monthly low at $111,986, before reclaiming its monthly open at $115,747 and even surging higher in line with previous predictions. Notably, the premier cryptocurrency swept above its previous all-time high before experiencing a crash by over 4%

Based on the monthly chart, the renowned analyst also explains that the Bitcoin market has now experienced five consecutive green monthly candles. However, the recent rejection indicates that price movement and momentum are taking on a parabolic curve. Therefore, price movement in September presents a crucial moment to confirm market direction. For this next month, KillaXBT nudges investors to watch whether BTC can hold above the current monthly open at $115,747. A sustained hold could pave the path for a move toward the $125,000–$127,000 regions, representing a marginal extension of the rally and potentially setting up another test of investor conviction at higher prices. However, KillaXBT also warns that Bitcoin opening the month of September with a new all-time high may not necessarily signal an uptrend continuation, but also indicate the cycle top. On the other hand, a breakdown below the monthly open would expose BTC to downside risk, with $111,986, the monthly low, acting as the first major support. It is worth stating that a loss of that level could accelerate a corrective phase.
Bitcoin Price Overview
At the time of writing, Bitcoin is trading at $117,559, reflecting a slight 0.66% price decrease in the past week. On larger timeframes, the premier cryptocurrency also reflects marginal price changes of +0.78% and -1.36% on the weekly and monthly charts, underscoring a choppy market environment despite recently setting new all-time highs.

Featured image from Pexels, chart from Tradingview
Bearish Case For Bitcoin: Analyst Warns Macro Top Is In
Bitcoin’s price rally has hit turbulence over the past 48 hours, and this has opened the door for be...
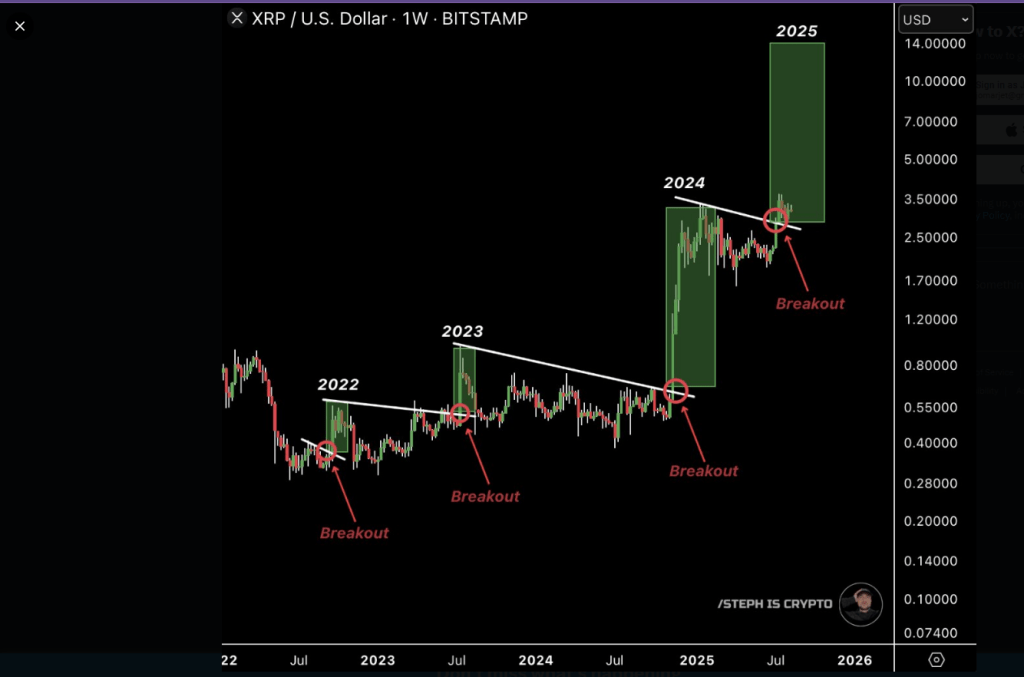
XRP’s Toughest Bull Run Could Lead To Big Gains, Analyst Claims
Bitcoin’s smaller cousin, XRP, has drawn fresh bullish bets after it held above the $3 mark in July....

Bitcoin Faces Strong Chance Of $150K Rally Before Downturn, CEO Says
Bitcoin’s recent climb looks steady but measured. Prices hovered at $118,350 when the key calls were...