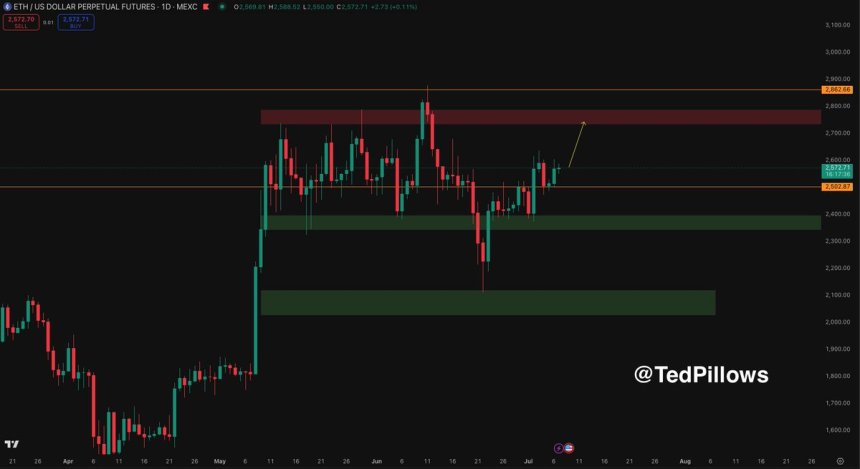
Ethereum Turns Key Resistance Into Support – Momentum Builds For Range Breakout


Ethereum is consolidating above the $2,500 mark, showing resilience amid broader market uncertainty. While bulls have successfully flipped $2,500 from resistance into support, the price still faces significant pressure below the $2,700 zone. This range-bound behavior has persisted since early May, and the coming days are likely to define the next major move, not only for ETH but also for the broader altcoin market.
Top analyst Ted Pillows shared technical insights, highlighting Ethereum’s current structure, particularly after the $2,500 level was reclaimed. However, the next challenge lies in reclaiming the range high. A breakout above this key resistance could trigger a strong bullish continuation and potentially ignite an altseason, as capital often rotates into altcoins once ETH gains momentum.
On the flip side, failure to sustain current support may open the door for a pullback toward lower demand levels. For now, bulls appear to be in control, but the market remains on edge, awaiting a decisive move. Whether ETH can build enough strength to break through resistance or slips into another leg of consolidation will likely shape sentiment and positioning for the weeks ahead.
Ethereum Builds Strength As It Eyes Range High
Ethereum continues to trade within a well-defined consolidation zone, oscillating between $2,400 and $2,700 since early May. After reclaiming the $2,500 level and flipping it into support, ETH now looks poised for a potential breakout. Ted Pillows highlighted this shift in momentum, stating that Ethereum is “looking good” and could soon revisit the upper boundary of the range.
However, despite Ethereum’s strength, broader market conditions remain mixed. Bitcoin’s failure to break above its all-time high adds pressure to the crypto market, and altcoins continue to struggle to find solid footing. While macroeconomic uncertainty has eased following encouraging job reports and legislative developments in the US, headwinds persist. Rising US Treasury yields and the Federal Reserve’s ongoing delay in cutting interest rates contribute to a cautious environment.
Still, Ethereum’s ability to hold above $2,500 suggests bullish intent. If price pushes toward and ultimately breaks above $2,700, it could trigger a broader move across altcoins, reawakening market momentum. But without a breakout in the short term, another leg of consolidation—or even a pullback—remains possible. This week may prove pivotal in setting the tone for Ethereum and the altcoin market’s next phase.
ETH Tests Resistance As Consolidation Tightens
Ethereum is trading at $2,550, holding above its key moving averages and continuing to consolidate in a tight range. The daily chart shows that ETH is attempting to break above the 200-day moving average (red), currently sitting near $2,488, while managing to stay above both the 50-day (blue) and 100-day (green) moving averages. This convergence of key technical levels highlights the current equilibrium between bulls and bears.
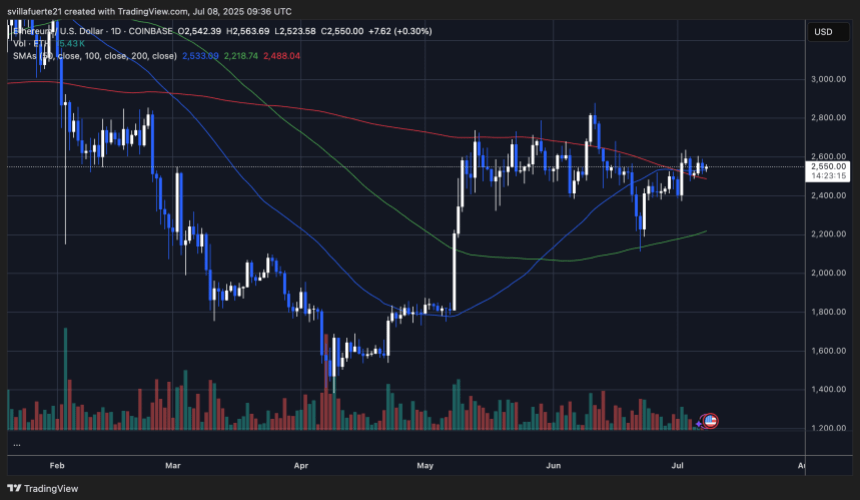
Despite multiple attempts since early May, Ethereum has not been able to sustain a breakout above the $2,700 mark. Each push higher has faced selling pressure, suggesting that this zone remains a major area of resistance. However, recent price action shows higher lows and strong defense of the $2,500 level, signaling building momentum.
Trading volume remains relatively flat, which aligns with the ongoing consolidation, but could also foreshadow a volatility spike once direction is confirmed. A successful daily close above the $2,600–$2,700 zone could trigger an impulsive move toward $3,000 and beyond. Conversely, a breakdown below the $2,480 level would invalidate the bullish structure and shift sentiment.
Featured image from Dall-E, chart from TradingView
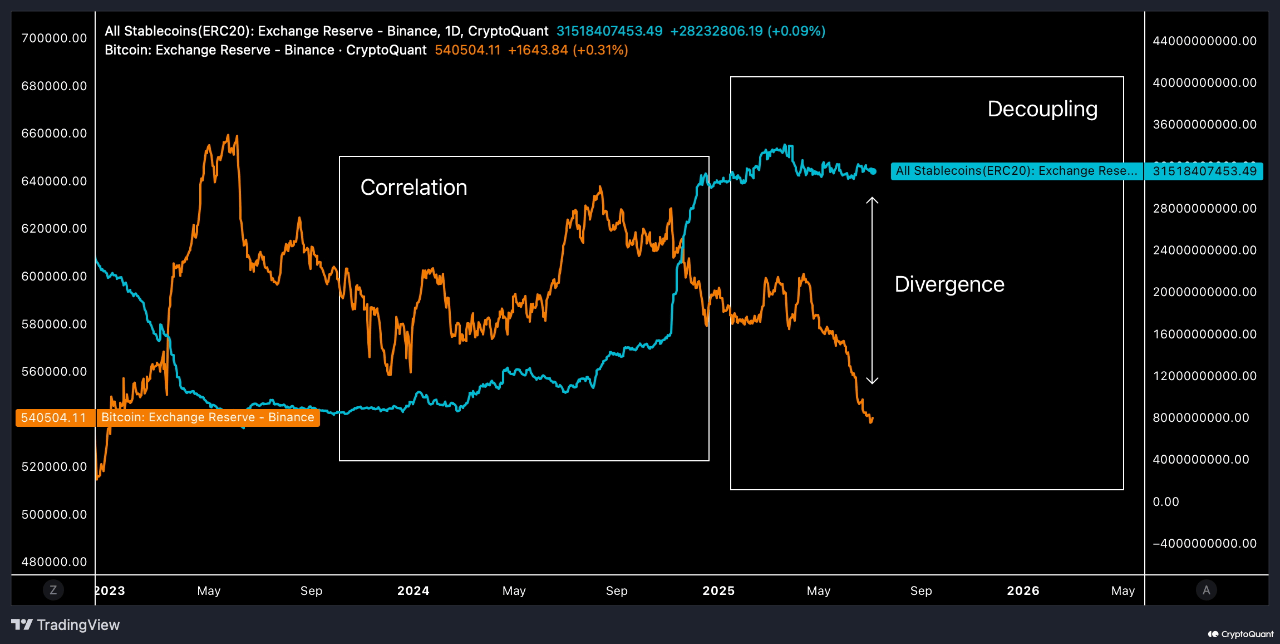
Bitcoin & Stablecoin Reserves Diverge On Binance: Liquidity Explosion Brewing?
On-chain data shows the Binance Exchange Reserve has diverged between Bitcoin and the stablecoins. H...

2% Of All XRP Is In His Hands — But Who Is He?
A long‑time figure in the world of digital money and a noted XRP advocate stepped out of the shadows...
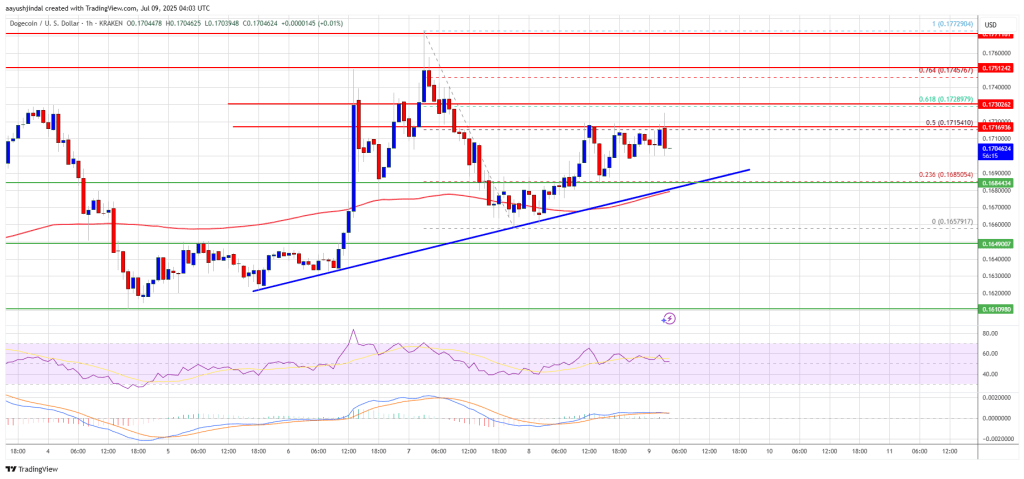
Dogecoin (DOGE) Eyes Breakout — Can Bulls Unleash the Next Surge?
Dogecoin started a fresh increase above the $0.1680 zone against the US Dollar. DOGE is now consolid...