BNB Price Gathers Strength — Upside Potential Looms


BNB price is gaining pace above the $632 support zone. The price is now showing positive signs and might aim for more gains in the near term.
- BNB price is attempting to recover from the $600 support zone.
- The price is now trading below $632 and the 100-hourly simple moving average.
- There was a break above a bearish trend line with resistance at $625 on the hourly chart of the BNB/USD pair (data source from Binance).
- The pair must stay above the $632 level to start another increase in the near term.
BNB Price Eyes More Gains
After forming a base above the $600 level, BNB price started a fresh increase. There was a move above the $620 and $625 resistance levels, like Ethereum and Bitcoin .
There was a decent move above the 50% Fib retracement level of the recent decline from the $651 swing high to the $602 low. Besides, there was a break above a bearish trend line with resistance at $625 on the hourly chart of the BNB/USD pair.
The price is now trading below $632 and the 100-hourly simple moving average. It is also consolidating near the 76.4% Fib retracement level of the recent decline from the $651 swing high to the $602 low.
On the upside, the price could face resistance near the $644 level. The next resistance sits near the $650 level. A clear move above the $650 zone could send the price higher. In the stated case, BNB price could test $665. A close above the $665 resistance might set the pace for a larger move toward the $680 resistance. Any more gains might call for a test of the $700 level in the near term.
Another Decline?
If BNB fails to clear the $644 resistance, it could start another decline. Initial support on the downside is near the $635 level. The next major support is near the $632 level.
The main support sits at $625. If there is a downside break below the $625 support, the price could drop toward the $612 support. Any more losses could initiate a larger decline toward the $600 level.
Technical Indicators
Hourly MACD – The MACD for BNB/USD is gaining pace in the bullish zone.
Hourly RSI (Relative Strength Index) – The RSI for BNB/USD is currently above the 50 level.
Major Support Levels – $632 and $625.
Major Resistance Levels – $644 and $650.
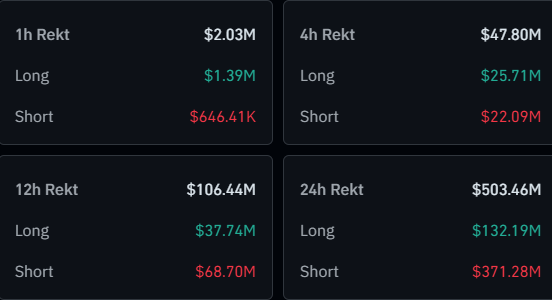
Crypto Bears Rekt: $359M Gone As Bitcoin, Ethereum Rebound
Data shows the rebound in Bitcoin and other cryptocurrencies has punished the bears, triggering a ma...
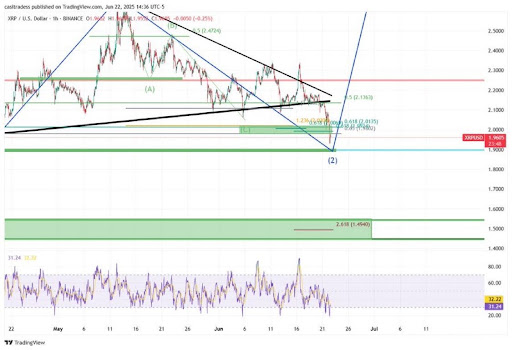
Analyst Says XRP Is Moving According To Plan, Here’s Why $1.90 Is Important
A crypto analyst has reaffirmed a bullish outlook for XRP, suggesting that the cryptocurrency’s pric...
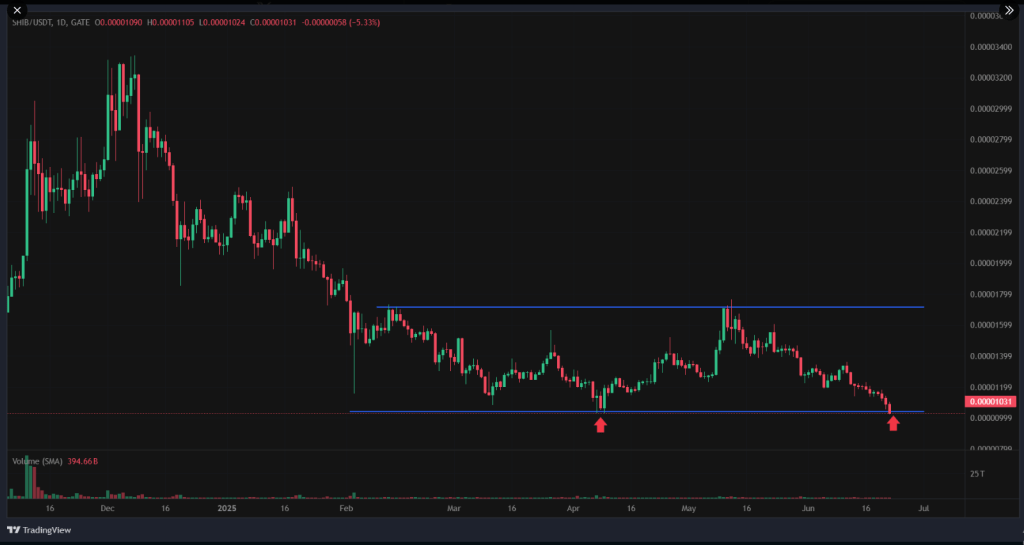
Shiba Inu Breakout Incoming? Bullish Setup Hints At Big Jump, Experts Say
Shiba Inu tumbled to an intraday bottom of $0.000010 on Sunday, marking its weakest point in 16 mont...