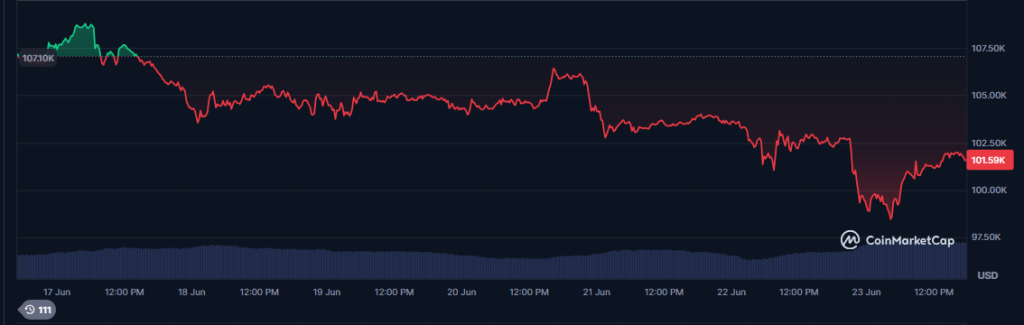
Bitcoin Price Dives as War Escalation Sparks Market Sell-Off


Bitcoin price started a fresh decline below the $103,000 zone. BTC is now consolidating and might struggle to recover above the $103,500 resistance.
- Bitcoin started a fresh decline below the $103,000 zone.
- The price is trading below $102,500 and the 100 hourly Simple moving average.
- There is a key bearish trend line forming with resistance at $101,250 on the hourly chart of the BTC/USD pair (data feed from Kraken).
- The pair could start a fresh increase if it stays above the $100,000 zone.
Bitcoin Price Dips Further
Bitcoin price started a fresh decline below the $105,500 zone. BTC gained pace and dipped below the $104,200 and $103,000 levels.
There was a clear move below the $102,000 support level. Finally, the price tested the $98,250 zone. A low was formed at $98,277 and the price started a consolidation phase. There was a minor recovery above the 23.6% Fib retracement level of the downward move from the $106,470 swing high to the $98,277 low.
However, the bears were active below the $101,200 zone. Bitcoin is now trading below $102,000 and the 100 hourly Simple moving average . There is also a key bearish trend line forming with resistance at $101,250 on the hourly chart of the BTC/USD pair.
On the upside, immediate resistance is near the $101,250 level. The first key resistance is near the $102,500 level or the 50% Fib retracement level of the downward move from the $106,470 swing high to the $98,277 low. The next key resistance could be $103,500.
A close above the $103,500 resistance might send the price further higher. In the stated case, the price could rise and test the $105,000 resistance level. Any more gains might send the price toward the $106,200 level.
Another Drop In BTC?
If Bitcoin fails to rise above the $102,000 resistance zone, it could start another decline. Immediate support is near the $100,150 level. The first major support is near the $98,500 level.
The next support is now near the $96,500 zone. Any more losses might send the price toward the $95,500 support in the near term. The main support sits at $95,000, below which BTC might struggle to find bids.
Technical indicators:
Hourly MACD – The MACD is now losing pace in the bearish zone.
Hourly RSI (Relative Strength Index) – The RSI for BTC/USD is now below the 50 level.
Major Support Levels – $100,150, followed by $100,000.
Major Resistance Levels – $101,250 and $103,500.

Cointelegraph and CoinMarketCap Hacked: Why Non-Custodial Wallets Are Necessary
Want to check on Bitcoin’s latest price moves? Just pop over to CoinMarketCap and… enter your wallet...
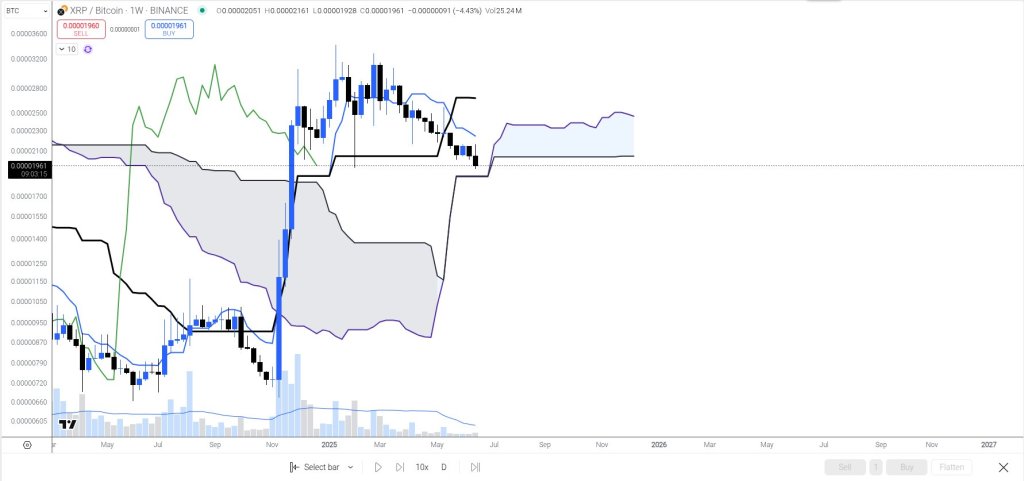
XRP To $30 Beyond 2026? Analyst Reveals Key BTC Ratio To Watch
The market technician known on X as Dr Cat (@DoctorCatX) has published a post that condenses years o...
Bitcoin Down But Not Out—Analyst Sees Recovery Ahead Amid Middle East War
Bitcoin briefly slid to $98,974 late on Sunday after US airstrikes targeted Iranian nuclear faciliti...