Dogecoin Caught In Compression: Descending Triangle Warns Of Potential Collapse


Dogecoin (DOGE) is teetering on a critical edge as price action tightens within a descending triangle pattern, hinting at rising bearish pressure. The meme-inspired cryptocurrency has entered a phase of low volatility and narrowing price movement, a classic sign of market indecision that often precedes a significant breakout or breakdown .
With the 200-period moving average applying dynamic resistance from above and horizontal support showing signs of strain, DOGE’s technical landscape suggests a potential collapse could be on the horizon if buyers fail to defend key levels.
Price Coils Within Bearish Formation Ahead Of Potential Breakout
Market analyst Thomas Anderson, in a recent post on X, pointed out that “DOGE is consolidating within a descending triangle pattern on the M30 timeframe,” signaling a period of indecision. This chart pattern, often seen in bearish continuations, is characterized by a flat support base with lower highs pressing from above. As Dogecoin trades deeper into this structure , the probability of a breakout, either upward or downward, is increasing with each narrowing move.
Anderson further explained that DOGE is “currently testing the upper resistance around $0.19998,” a key level that has capped recent bullish attempts. This resistance aligns with the descending trendline of the triangle and is strengthened by the 200 MA (red line), acting as dynamic resistance.

The presence of the 200-period moving average at this level adds extra weight to the upper line, making any potential breakout attempt more challenging for the bulls in the near term. Until price action breaks decisively in either direction, DOGE remains locked in a tightening range. For now, Anderson’s observations underline the importance of this technical structure, as DOGE nears a critical inflection point.
Triangle Compression Builds Tension For Dogecoin
The analyst further emphasized that momentum appears to be weakening as Dogecoin’s price action tightens near the apex of the descending triangle. According to the expert’s observations, the 1-hour chart reinforces this broader consolidation phase, showing a clear compression of price within the pattern. This type of setup often leads to an explosive move once the market chooses a direction.
A confirmed breakout above the $0.19998 resistance could pave the way for a short-term bullish run, with higher targets potentially opening up if volume supports the move, potentially invalidating the bearish triangle pattern. However, failure to breach this resistance level may reinforce the bearish structure, increasing the likelihood of a pullback toward the lower triangle support around $0.19010, a critical area where buyers previously stepped in.

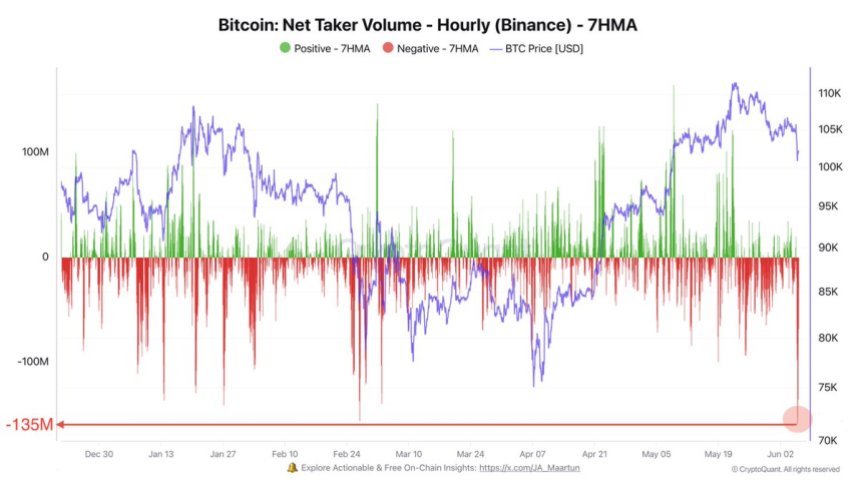
Bitcoin Sees Largest Net Taker Volume Drop Of 2025 – Traders React To Trump-Elon Clash
Bitcoin has continued to show strength amid rising macroeconomic uncertainty, with surging U.S. bond...

Musk Exits DOGE, Clashes With Trump—Dogecoin Gets Caught In The Crossfire
Dogecoin took a hard hit this week as tensions flared between Elon Musk and US President Donald Trum...
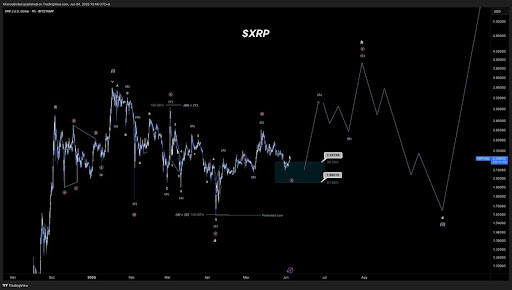
XRP Wave Structure Predicts Wild Fluctuations On Its Way To $4 ATH
The XRP price action is drawing significant attention, as analysts highlight a distinct wave structu...