XRP Price at Risk of More Losses — Can Key Support Hold?


XRP price started a fresh decline below the $2.220 zone. The price is now correcting losses and might aim for a move above the $2.20 resistance.
- XRP price started a fresh decline below the $2.220 zone.
- The price is now trading below $2.20 and the 100-hourly Simple Moving Average.
- There is a key bearish trend line forming with resistance at $2.2180 on the hourly chart of the XRP/USD pair (data source from Kraken).
- The pair might start another decline if it fails to clear the $2.220 level.
XRP Price Dips Again
XRP price failed to clear the $0.3250 resistance and started a fresh decline, like Bitcoin and Ethereum . There was a move below the $0.2800 and $0.2620 support levels.
The price even dipped below the $0.20 support level. A low was formed at $0.2081 and the price is now consolidating losses. There was a minor move above the $0.2120 level. The price cleared the 23.6% Fib retracement level of the downward wave from the $2.3540 swing high to the $2.2081 low.
The price is now trading below $2.220 and the 100-hourly Simple Moving Average. On the upside, the price might face resistance near the $2.20 level. The first major resistance is near the $2.220 level. There is also a key bearish trend line forming with resistance at $2.2180 on the hourly chart of the XRP/USD pair. It is near the 50% Fib retracement level of the downward wave from the $2.3540 swing high to the $2.2081 low.
The next resistance is $2.250. A clear move above the $2.250 resistance might send the price toward the $2.280 resistance. Any more gains might send the price toward the $2.30 resistance or even $2.3250 in the near term. The next major hurdle for the bulls might be $2.40.
Another Drop?
If XRP fails to clear the $2.220 resistance zone, it could start another decline. Initial support on the downside is near the $2.1250 level. The next major support is near the $2.080 level.
If there is a downside break and a close below the $2.080 level, the price might continue to decline toward the $2.050 support. The next major support sits near the $2.00 zone.
Technical Indicators
Hourly MACD – The MACD for XRP/USD is now gaining pace in the bearish zone.
Hourly RSI (Relative Strength Index) – The RSI for XRP/USD is now below the 50 level.
Major Support Levels – $2.120 and $2.080.
Major Resistance Levels – $2.20 and $2.220.
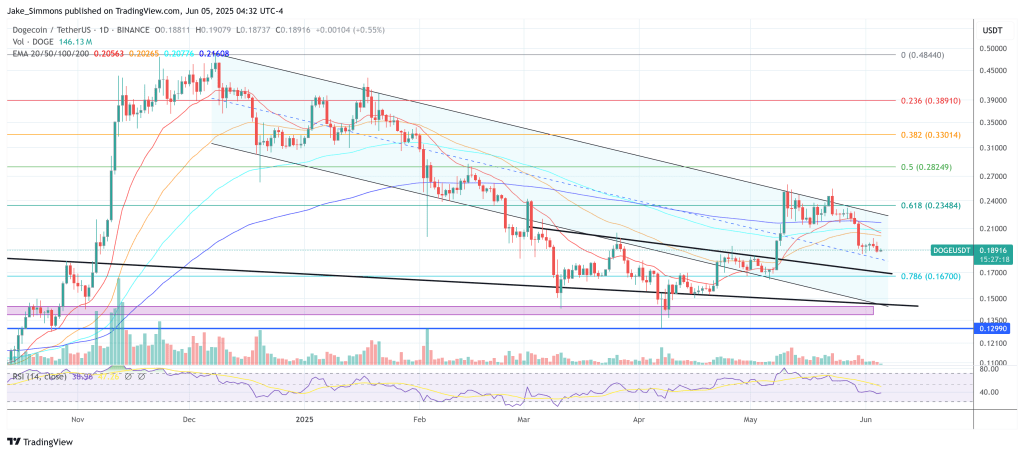
Dogecoin Needs $0.40 Breakout To Salvage Bull Case, Says Analyst
Dogecoin’s six-month slide may be about to reach its moment of truth, according to independent marke...

Bitcoin Scarcity May Spark Explosive Surge, Bank Study Shows
Bitcoin’s available coins for trading have dropped sharply. That change could push prices higher if ...
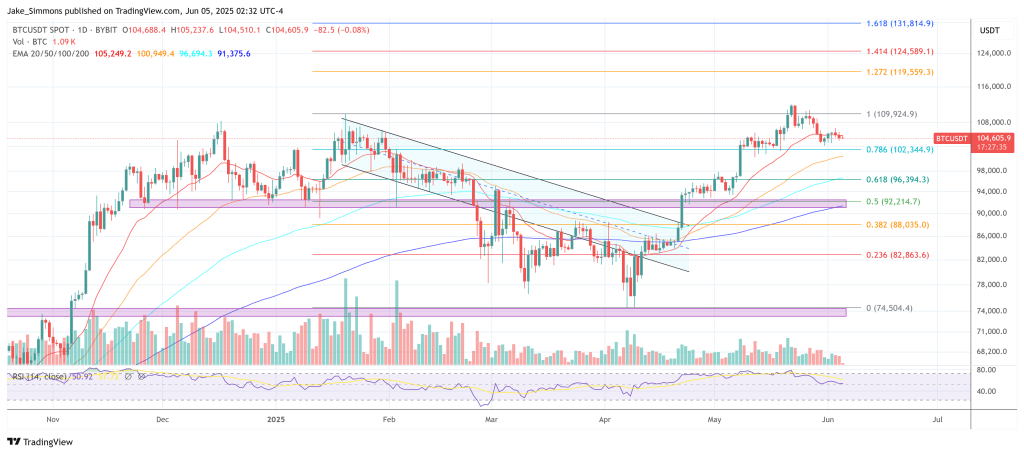
The Last Bitcoin Cycle? Swan Says History’s Turning
Bitcoin is drifting just above $105,000 on June 5, its lowest realized volatility in almost two year...