Bitcoin Sets New ATH, But This Metric Says No Overheating Yet


The Bitcoin Network Value to Transactions (NVT) Golden Cross could indicate that the asset isn’t overheated yet, despite its price marching to a new all-time high (ATH).
Bitcoin NVT Golden Cross Still Outside Of Overbought Zone
In a CryptoQuant Quicktake post , an analyst has talked about the latest trend in the NVT Golden Cross for Bitcoin. The NVT Ratio is an on-chain indicator that keeps track of the ratio between the BTC market cap and transaction volume.
If the utility of the network (measured in terms of the transfer volume) is considered as a reflection of its ‘true’ value, then this ratio can be used for judging whether the price is undervalued or overvalued.
When the value of the indicator is high, it means the value of the network (that is, the market cap) is high compared to its ability to transact coins. Such a trend may be a sign that the asset is becoming overpriced.
On the other hand, the indicator being low could imply room for growth in the cryptocurrency’s market cap, as its value is low when compared to the transaction volume.
In the context of the current topic, a derivative form of the NVT Ratio is the indicator of interest. This metric, known as the NVT Golden Cross , is a signaling indicator for the NVT Ratio similar to the Bollinger Bands, telling us about whether the ratio’s value is near a top or bottom.
The NVT Golden Cross compares two moving averages (MAs) of the NVT Ratio in order to determine this: the 10-day MA to gauge the short-term trend and the 30-day MA for the long-term one.
Now, here is a chart that shows the trend in the Bitcoin NVT Golden Cross over the last few months:

As displayed in the above graph, the Bitcoin NVT Golden Cross has been on the rise recently as the cryptocurrency’s price has rallied to a new ATH . At present, the indicator is sitting at a value of 1.5.
In the chart, the quant has highlighted two zones for the metric that have been of significance in the past. The region beyond 2.2 (shaded in red) corresponds to the territory where tops generally occur for BTC and that under -1.6 (green) to the bottoming zone.
Clearly, despite the recent uptrend, the NVT Golden Cross hasn’t yet broken into the red zone, a potential sign that the cryptocurrency may still not be too overpriced. Naturally, this could allow room for the run to continue further.
BTC Price
Bitcoin set a new record earlier today as its price briefly went to $109,400, surpassing the previous ATH around $109,200.

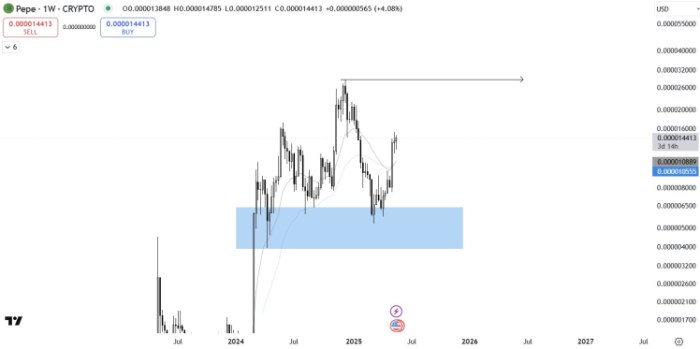
Why MIND of Pepe is the Best Crypto to Buy Now as Pepe Enjoys Life in Green
Self-proclaimed as the ‘most memeable meme coin,’ $PEPE is one of the most prominent and culturally ...
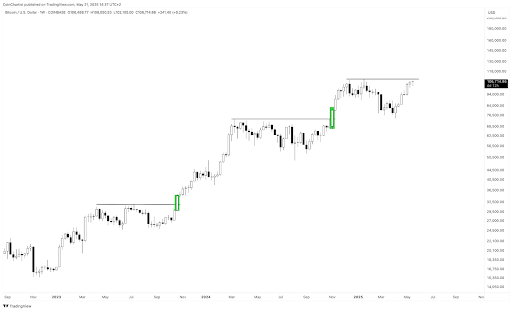
Crypto Analyst Puts Bitcoin Price At $120,000 If This Range Breakout Happens
The Bitcoin price is flying high at the moment, having rallied to a new all-time high (ATH) of $111,...
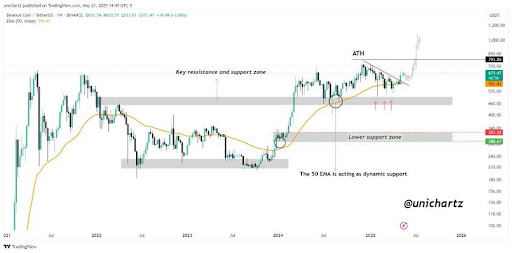
BNB Rally To All-Time High Grows Strong, But This Crucial Zone Must Hold
BNB weekly chart is catching attention after market analyst UniChartz noted that the cryptocurrency ...