Top Researcher Says Bitcoin Going Higher Amid Global M2 Expansion Trends

Favorite
Share
Scan with WeChat
Share with Friends or Moments
Crypto researcher Julien Bittel links the ongoing Bitcoin surge to global M2, suggesting that the largest cryptocurrency may climb further in the coming weeks.
Bitcoin briefly surged past the $100,000 mark this week, climbing as high as $104,000 before settling near $103,000. This movement followed reports suggesting U.S. and Chinese officials would meet in Switzerland over the weekend to discuss a possible trade agreement.
The news injected optimism into markets, pushing Bitcoin higher. Yet, beyond this headline-driven jump, ongoing analysis of liquidity trends and their relationship to Bitcoin is taking center stage, with contrasting views from key market observers.
Global M2 as a Leading Indicator for Bitcoin
For instance, Julien Bittel, Head of Macro Research at Global Macro Investor (GMI), has
pointed
to a chart linking global M2 money supply to Bitcoin’s price action.
According to Bittel, the chart shows M2 acting as a 12-week leading indicator, where increases in global liquidity often precede Bitcoin rallies by about three months. Over the past two years, this pattern has remained consistent.
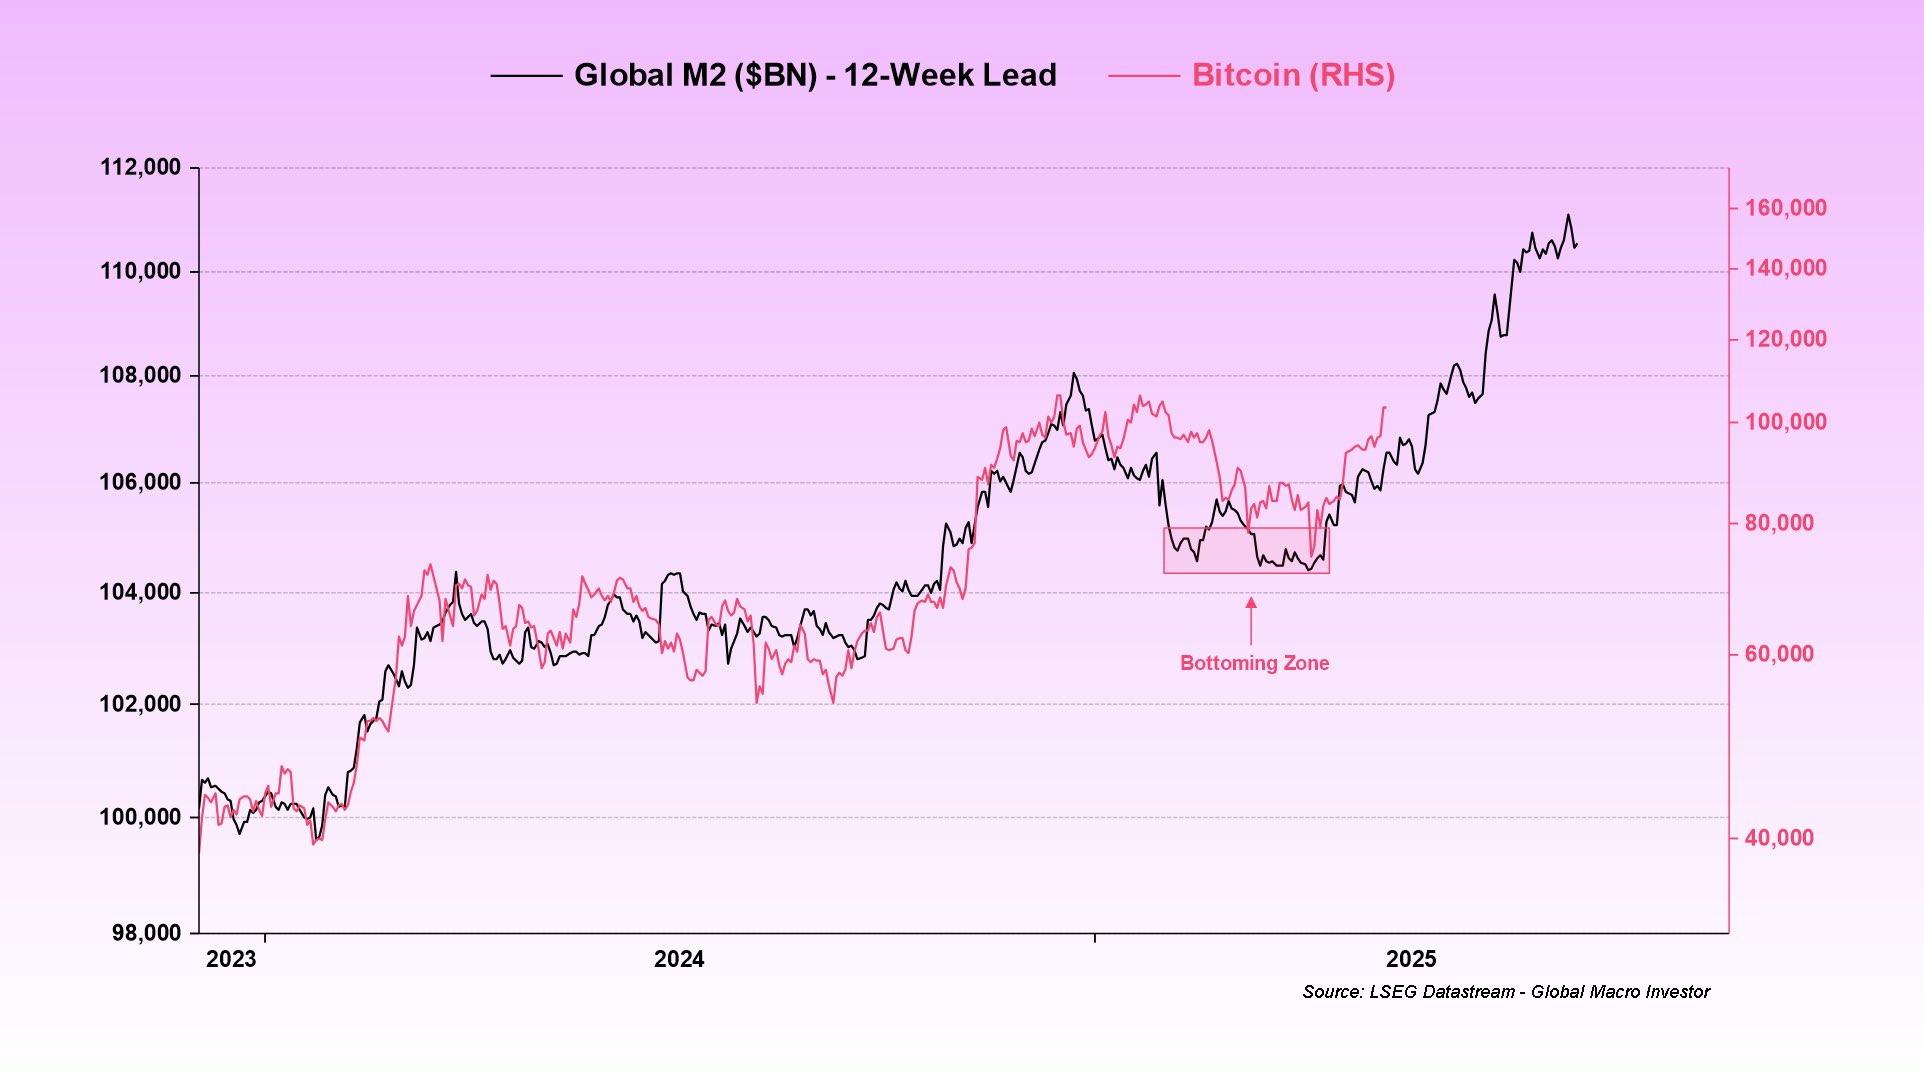 From early 2023 to early 2024, global M2 steadily climbed from around $98 trillion to just above $108 trillion. Bitcoin’s price action mirrored this rise, with a notable rally over $100,000 by late 2024.
However, mid-2024 saw a temporary pause in M2 growth, which coincided with Bitcoin entering a range-bound phase, dipping below $80,000. This phase, described as a “bottoming zone,” marked a consolidation period that aligned closely with the M2 stagnation.
Since late 2024, global M2 has resumed a sharp upward trajectory, now exceeding $111 trillion. Based on the existing 12-week lead relationship, this recent rise may signal continued Bitcoin strength into mid-2025.
Bittel stated that the recent surge in global M2 indicates further upside for Bitcoin in the weeks ahead, noting, "We’re going higher."
Alternative View: Bitcoin as a Leading Signal
Meanwhile, Benjamin Cohen has questioned the narrative that Bitcoin lags liquidity. On X,
he challenged
the offset-based approach often used in liquidity charts. He noted that applying a three- to four-month M2 lead fails to align with Bitcoin’s 2021 and 2017 tops, both of which occurred before M2 peaked.
Instead, Cohen proposed that Bitcoin could lead liquidity trends. Under this framework, the 2021 Bitcoin peak aligns directly with M2’s later rise, while Bitcoin’s summer 2022 lows correspond with a delayed M2 bottom. He noted the FTX collapse extended Bitcoin’s decline beyond the liquidity signal’s timing.
This perspective implies
Bitcoin’s
current surge could suggest an upcoming contraction in global M2, rather than continued expansion. This interpretation challenges the prevailing assumption and raises new questions about Bitcoin’s role in macroeconomic forecasting.
Impact of DXY and Market Implications
As Cohen expands his analysis, he suggests that movements in the U.S. Dollar Index (DXY) could explain changes in global M2. Because global M2 largely reflects dollar strength, a rising DXY could reduce global liquidity. He traced DXY’s trajectory from late 2024 and anticipates a rally back to its 20-week simple moving average before further declines in 2026.
According to Cohen, if Bitcoin is indeed leading liquidity, a DXY rebound may push global M2 lower into the summer. This development could impact crypto markets more broadly, especially altcoin-to-Bitcoin pairs. Historically, these pairs tend to weaken when the dollar strengthens, suggesting a potential downtrend in alternative assets relative to
Bitcoin
.
From early 2023 to early 2024, global M2 steadily climbed from around $98 trillion to just above $108 trillion. Bitcoin’s price action mirrored this rise, with a notable rally over $100,000 by late 2024.
However, mid-2024 saw a temporary pause in M2 growth, which coincided with Bitcoin entering a range-bound phase, dipping below $80,000. This phase, described as a “bottoming zone,” marked a consolidation period that aligned closely with the M2 stagnation.
Since late 2024, global M2 has resumed a sharp upward trajectory, now exceeding $111 trillion. Based on the existing 12-week lead relationship, this recent rise may signal continued Bitcoin strength into mid-2025.
Bittel stated that the recent surge in global M2 indicates further upside for Bitcoin in the weeks ahead, noting, "We’re going higher."
Alternative View: Bitcoin as a Leading Signal
Meanwhile, Benjamin Cohen has questioned the narrative that Bitcoin lags liquidity. On X,
he challenged
the offset-based approach often used in liquidity charts. He noted that applying a three- to four-month M2 lead fails to align with Bitcoin’s 2021 and 2017 tops, both of which occurred before M2 peaked.
Instead, Cohen proposed that Bitcoin could lead liquidity trends. Under this framework, the 2021 Bitcoin peak aligns directly with M2’s later rise, while Bitcoin’s summer 2022 lows correspond with a delayed M2 bottom. He noted the FTX collapse extended Bitcoin’s decline beyond the liquidity signal’s timing.
This perspective implies
Bitcoin’s
current surge could suggest an upcoming contraction in global M2, rather than continued expansion. This interpretation challenges the prevailing assumption and raises new questions about Bitcoin’s role in macroeconomic forecasting.
Impact of DXY and Market Implications
As Cohen expands his analysis, he suggests that movements in the U.S. Dollar Index (DXY) could explain changes in global M2. Because global M2 largely reflects dollar strength, a rising DXY could reduce global liquidity. He traced DXY’s trajectory from late 2024 and anticipates a rally back to its 20-week simple moving average before further declines in 2026.
According to Cohen, if Bitcoin is indeed leading liquidity, a DXY rebound may push global M2 lower into the summer. This development could impact crypto markets more broadly, especially altcoin-to-Bitcoin pairs. Historically, these pairs tend to weaken when the dollar strengthens, suggesting a potential downtrend in alternative assets relative to
Bitcoin
.
Disclaimer: This article is copyrighted by the original author and does not represent MyToken’s views and positions. If you have any questions regarding content or copyright, please contact us.(www.mytokencap.com)contact
About MyToken:https://www.mytokencap.com/aboutusArticle Link:https://www.mytokencap.com/news/504927.html
Related Reading
Brazil’s B3 to Launch Ethereum and Solana Futures, Cuts Bitcoin Contract Size
The Brazilian Securities and Exchange Commission (CVM) has approved the launch of Ethereum and Solan...
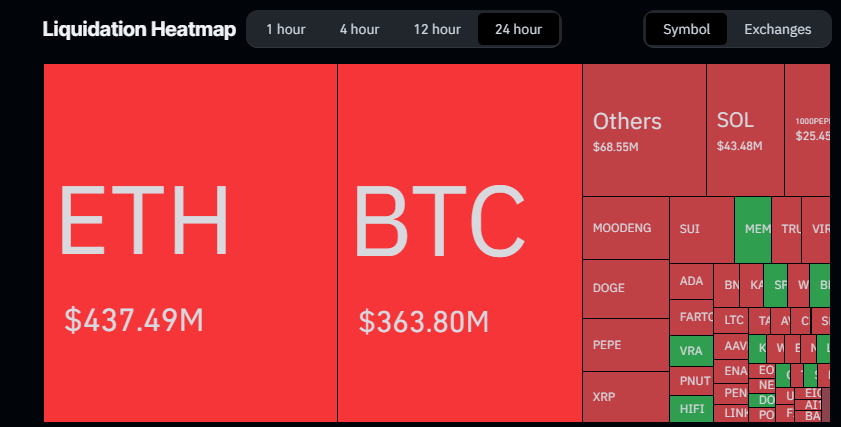
Bitcoin and Ethereum Hunt Bears as Crypto Short Liquidation Hits 4-Year High of $871M
Meteoric price rallies from Bitcoin and Ethereum dealt severe blows to bears, with liquidation figur...
CryptoQuant CEO Admits He Was Wrong in Saying Bitcoin Bull Run is Over Amid Push Above $100K
CryptoQuant CEO Ki Young Ju has publicly retracted his previous bearish forecast, citing sustained i...