Ethereum Price Slips Below $1,800 While ETH/BTC Pair Enters Key Consolidation Phase


- Ethereum holds key support at 0.0185 BTC after April rebound from monthly lows.
- ETH/USD drops below $1,800 amid low volume and rising market volatility.
- RSI signals neutrality, with traders awaiting news for ETH’s next major move.
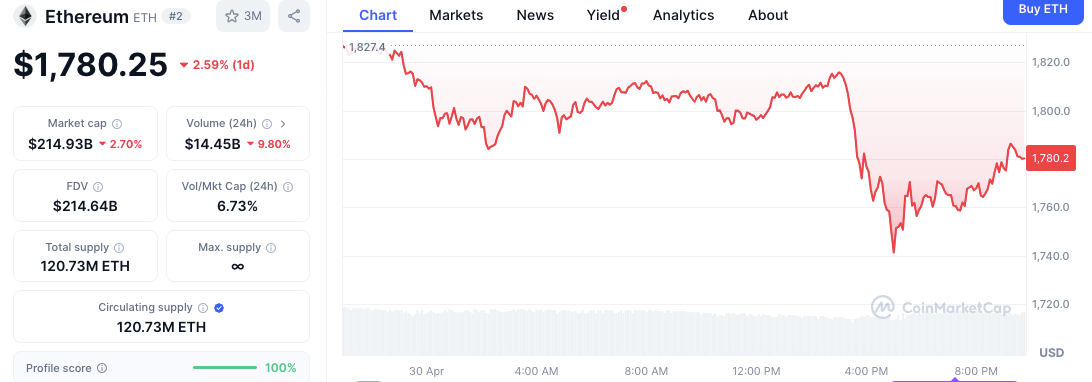
Ethereum experienced a major price decline on April 30, 2025, falling 2.59% within 24 hours to close at $1,780.25, according to data from CoinMarketCap. The intraday action saw Ethereum fall from a high of around $1,827 to a low near $1,735, before recovering marginally by evening.
The drop came amid broader market uncertainty, contributing to a 2.70% decline in Ethereum’s market capitalization, which ended the day at $214.93 billion. Trading volume also fell by 9.80% to $14.45 billion, bringing the volume-to-market cap ratio to 6.73%, indicating moderate market activity relative to ETH’s total value.

Ethereum’s circulating supply remained steady at 120.73 million tokens, with the fully diluted valuation (FDV) equaling the market cap. This alignment between supply metrics and valuation signals no current inflationary pressure. However, the sudden intra-day movement underscored rising volatility as ETH faces resistance near the $1,800 mark.
ETH/BTC Pair Shows Signs of Strength Near Critical Support
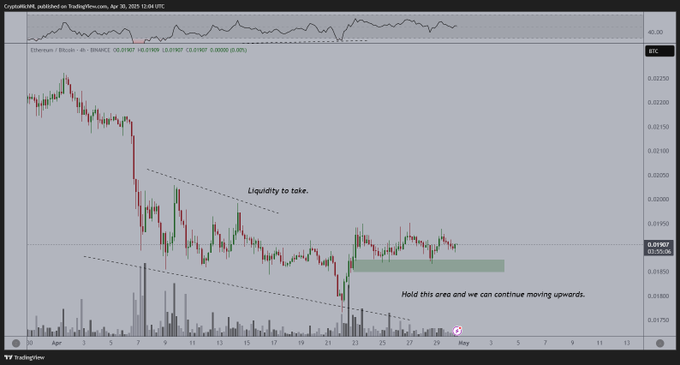
While ETH/USD traded under pressure, the ETH/BTC trading pair showed early signs of stabilization after enduring a persistent decline throughout April. Ethereum rebounded from the 0.0180 BTC level around April 21 and has since entered a consolidation phase, as seen in the most recent 4-hour chart that CryptoAKM shared. The pair now trades above a key support area near 0.0185 BTC, a zone identified by analysts as crucial for maintaining any bullish structure in the short term.
A green horizontal band on the chart represents this support zone, where increased buying volume has emerged, confirming the level’s significance. If Ethereum holds above this threshold, it could pave the way for a test of higher liquidity levels positioned along a descending trendline. This trendline, marked “Liquidity to take,” is a potential upper target area, where sell-side pressure may intensify due to stop-loss clusters.
Technical Indicators Signal a Neutral Stance
The Relative Strength Index (RSI) on the ETH/BTC 4-hour chart continues to hover in neutral territory. This technical reading indicates a lack of extreme price conditions and leaves room for movement in either direction. Analysts note that the absence of oversold or overbought signals indicates ongoing market indecision, as Ethereum consolidates within a narrow range.
The price distribution has not broken out yet but the formation points upwards if ETH manages to maintain the price above the chosen support level. Nevertheless, if the price breaks down below the 0.0185 BTC mark, it could trigger bearish pressure again and jeopardize the bounce.
Market Sentiment Remains Tentative Ahead of May Sessions
Although the ETH/BTC correlation continues to be rather stable in comparison with BTC, Ethereum’s overall performance in USD has been weaker. The failure to sustain a price above $1,800 is a sign of market consolidation, and there are no clear reasons for buying pressure at the moment. However, during the same trading session on April 30, trading was rather flat, while volatility stayed high with more noticeable fluctuations.

Observers eagerly watch early May events to get clues of the next direction. Any news concerning the protocols or macroeconomics could potentially bring significant fluctuations to ETH/USD and ETH/BTC.

11.3K Bitcoin Deposited to Binance on February 25: Whales React to Bitcoin and XRP Drops
Bitcoin and whale behavior show that market instability has prompted whales to deposit 11.3K to Bina...

Bitcoin Surpasses $96,000 Resistance, Closing in on $100,000 Mark
As per the data from Crypto Dan, Bitcoin $BTC has exceeded the key resistance at the $96,000 while n...

Eliza Labs Unveils Eliza.Systems to Bring Transparent AI to Public Sector
Eliza Labs unveils Eliza.Systems, a dedicated government subsidiary, to offer open-source AI tools—c...

