XRP Price Momentum Spikes — $2.25 Break Could Spark Bigger Rally


XRP price started a fresh increase above the $2.150 zone. The price is now consolidating above $2.20 and might clear the $2.250 resistance.
- XRP price started a fresh increase above the $2.120 zone.
- The price is now trading above $2.150 and the 100-hourly Simple Moving Average.
- There is a connecting bullish trend line forming with support at $2.20 on the hourly chart of the XRP/USD pair (data source from Kraken).
- The pair might gain bullish momentum if it clears the $2.250 resistance zone.
XRP Price Gains Strength
XRP price started a recovery wave above the $2.0650 and $2.10 resistance levels, like Bitcoin and Ethereum . The price traded above the $2.120 and $2.150 levels to start a decent increase.
The bulls even pushed the price toward $2.250 before the bears appeared. A high was formed at $2.2490 and the price started a downside correction. There was a move below the $2.2350 and $2.2220 support levels. The price even tested the 23.6% Fib retracement level of the upward move from the $2.060 swing low to the $2.2490 high.
However, the bulls protected the $2.20 support. The price is now trading above $2.220 and the 100-hourly Simple Moving Average. There is also a connecting bullish trend line forming with support at $2.20 on the hourly chart of the XRP/USD pair.
On the upside, the price might face resistance near the $2.2450 level. The first major resistance is near the $2.250 level. The next resistance is $2.350. A clear move above the $2.350 resistance might send the price toward the $2.50 resistance. Any more gains might send the price toward the $2.620 resistance or even $2.650 in the near term. The next major hurdle for the bulls might be $2.80.
Another Decline?
If XRP fails to clear the $2.250 resistance zone, it could start another decline. Initial support on the downside is near the $2.20 level and the trend line. The next major support is near the $2.150 level and the 50% Fib retracement level of the upward move from the $2.060 swing low to the $2.2490 high.
If there is a downside break and a close below the $2.150 level, the price might continue to decline toward the $2.120 support. The next major support sits near the $2.080 zone.
Technical Indicators
Hourly MACD – The MACD for XRP/USD is now gaining pace in the bullish zone.
Hourly RSI (Relative Strength Index) – The RSI for XRP/USD is now above the 50 level.
Major Support Levels – $2.20 and $2.150.
Major Resistance Levels – $2.250 and $2.350.
Bitcoin Spot Volume Nearly Triples As BTC Breaks $91,000
On-chain data shows the Bitcoin spot market hasn’t been left behind during the latest price rally as...
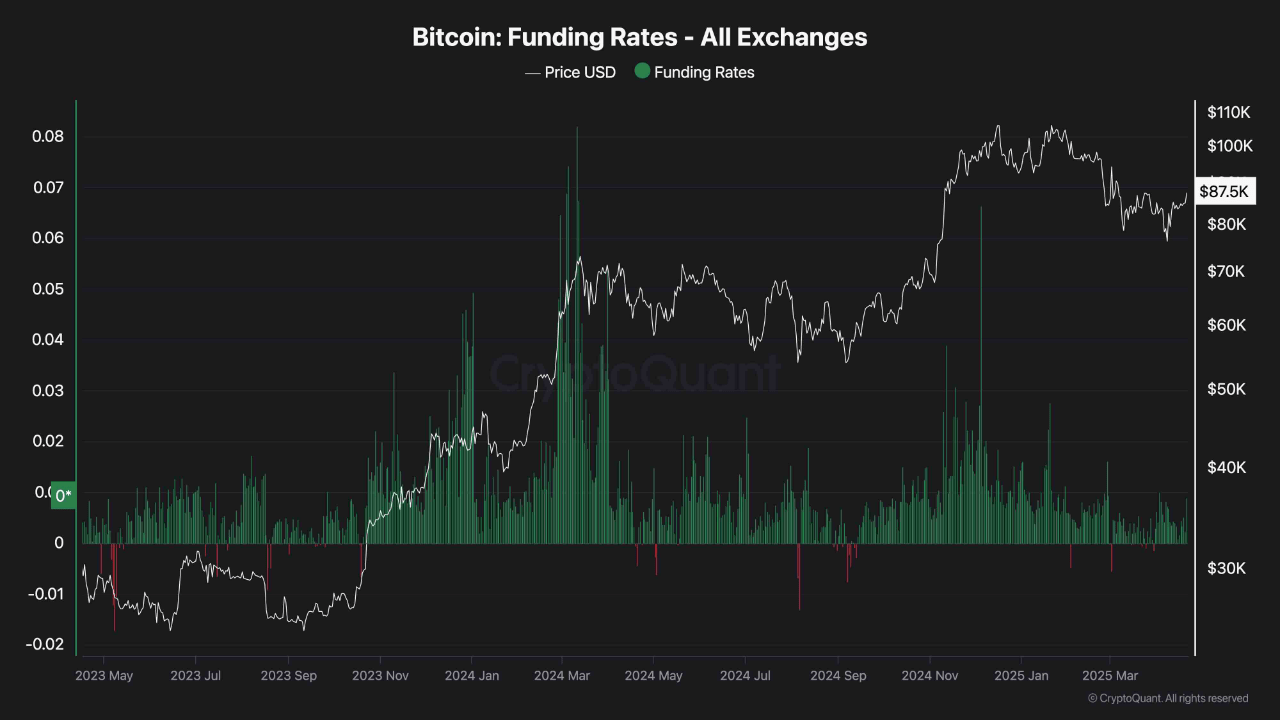
Bitcoin Regains $90K With Funding Rates Indicating Momentum Toward $93K
Bitcoin has finally reclaimed the psychologically $90,000 level once again following a recent period...
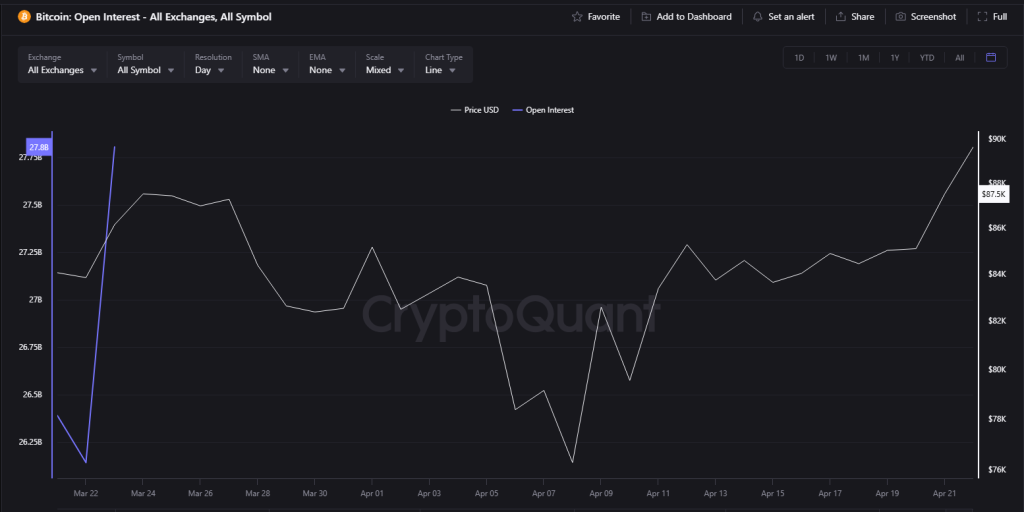
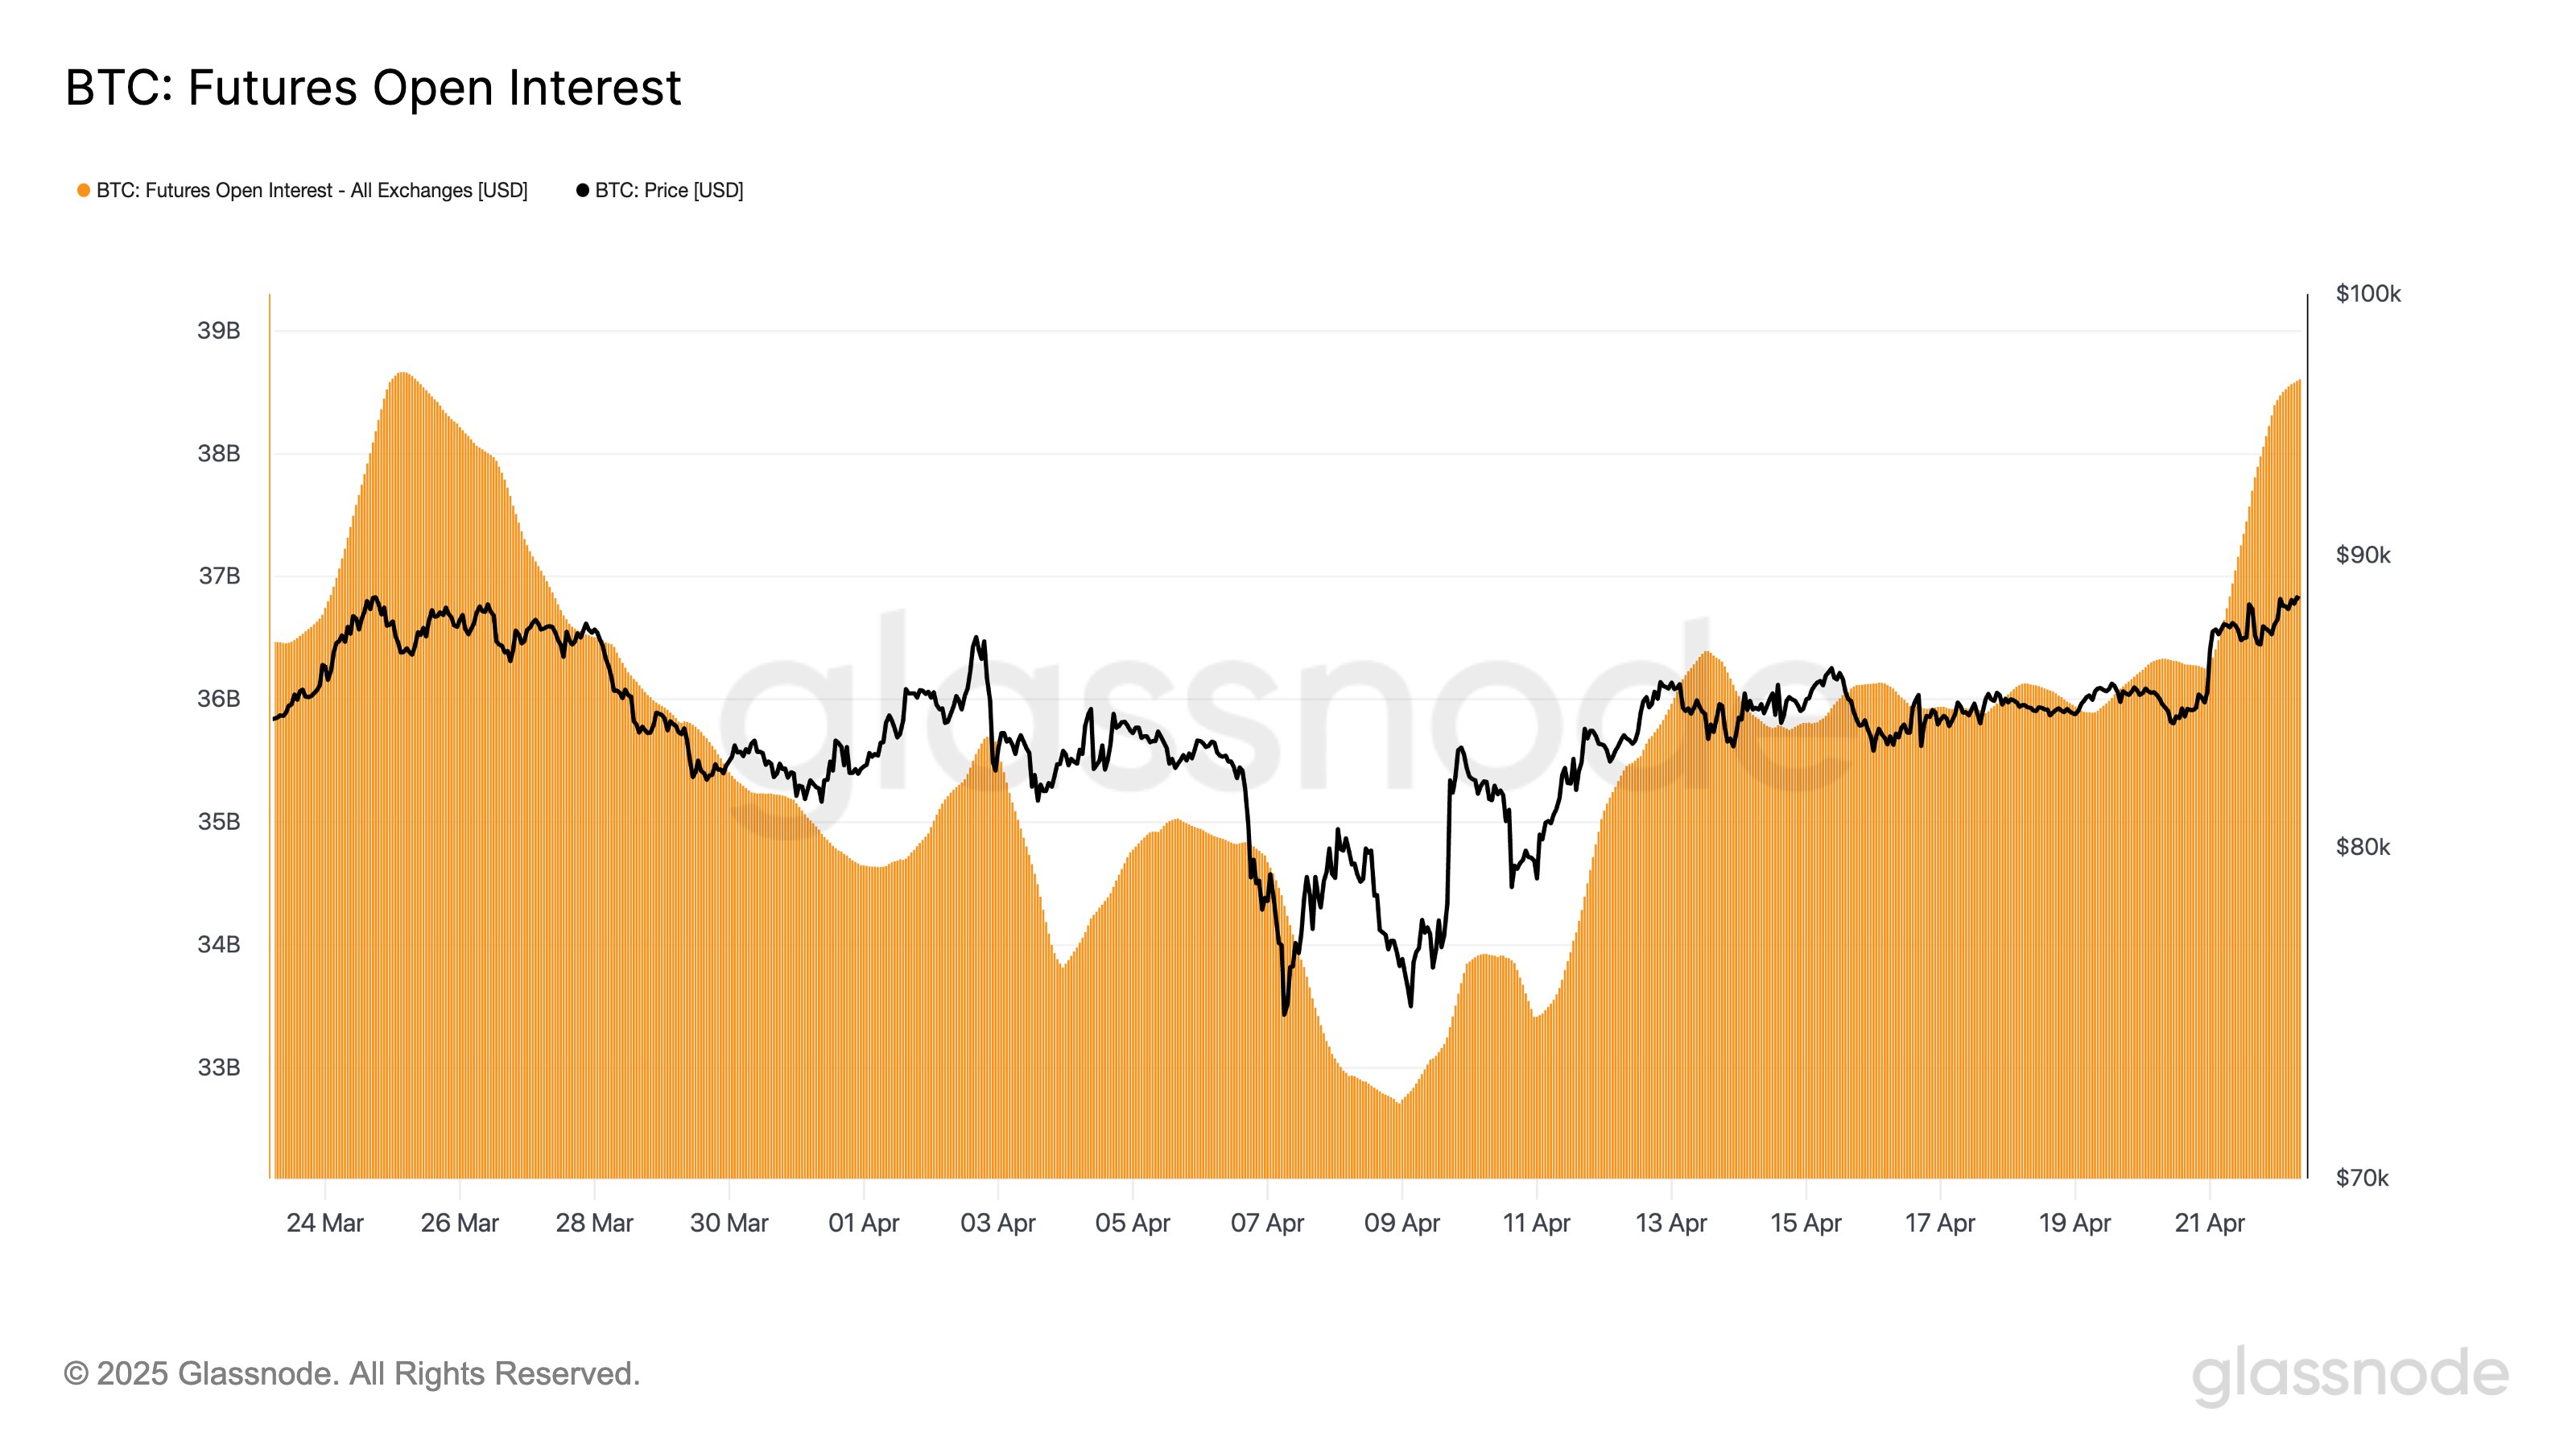
Bitcoin Rockets To Monthly Highs As Open Interest Explodes By Over $3 Billion
Bitcoin rose to $89,292 today, its highest since April 2, as traders injected funds into cryptocurre...