XRP Price Pulls Back: Healthy Correction or Start of a Fresh Downtrend?


XRP price started a fresh increase above the $2.20 resistance. The price is now correcting gains and might find bids near the $2.050 zone.
- XRP price started a downside correction from the $2.250 resistance zone.
- The price is now trading below $2.120 and the 100-hourly Simple Moving Average.
- There was a break below a connecting bullish trend line with support at $2.140 on the hourly chart of the XRP/USD pair (data source from Kraken).
- The pair might extend losses if there is a close below the $2.050 support zone.
XRP Price Dips Again
XRP price started a fresh increase above the $1.980 resistance, like Bitcoin and Ethereum . The price climbed above the $2.020 and $2.050 resistance levels.
A high was formed at $2.244 and the price recently started a downside correction. There was a move below the $2.120 support zone. Besides, there was a break below a connecting bullish trend line with support at $2.140 on the hourly chart of the XRP/USD pair.
The price even spiked below the 50% Fib retracement level of the upward move from the $1.920 swing low to the $2.244 high. The price is now trading below $2.120 and the 100-hourly Simple Moving Average.
On the upside, the price might face resistance near the $2.120 level. The first major resistance is near the $2.180 level. The next resistance is $2.20. A clear move above the $2.20 resistance might send the price toward the $2.250 resistance. Any more gains might send the price toward the $2.320 resistance or even $2.350 in the near term. The next major hurdle for the bulls might be $2.50.
Another Decline?
If XRP fails to clear the $2.120 resistance zone, it could start another decline. Initial support on the downside is near the $2.050 level and the 61.8% Fib retracement level of the upward move from the $1.920 swing low to the $2.244 high. The next major support is near the $2.00 level.
If there is a downside break and a close below the $2.00 level, the price might continue to decline toward the $1.920 support. The next major support sits near the $1.840 zone.
Technical Indicators
Hourly MACD – The MACD for XRP/USD is now gaining pace in the bearish zone.
Hourly RSI (Relative Strength Index) – The RSI for XRP/USD is now below the 50 level.
Major Support Levels – $2.050 and $2.00.
Major Resistance Levels – $2.120 and $2.180.
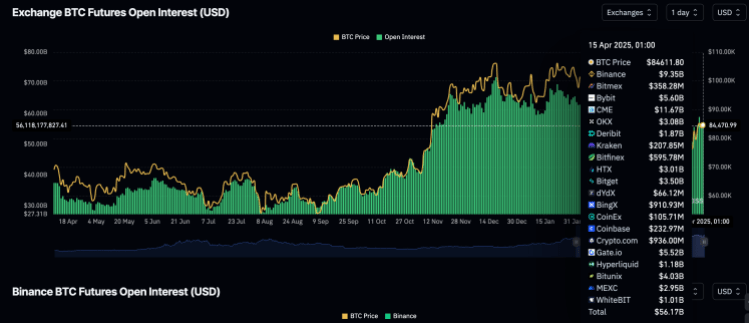
Is The Bitcoin Open Interest Too High Or Can The BTC Price Still Rally?
The Bitcoin open interest has remained on the high side despite the price declines, suggesting that ...
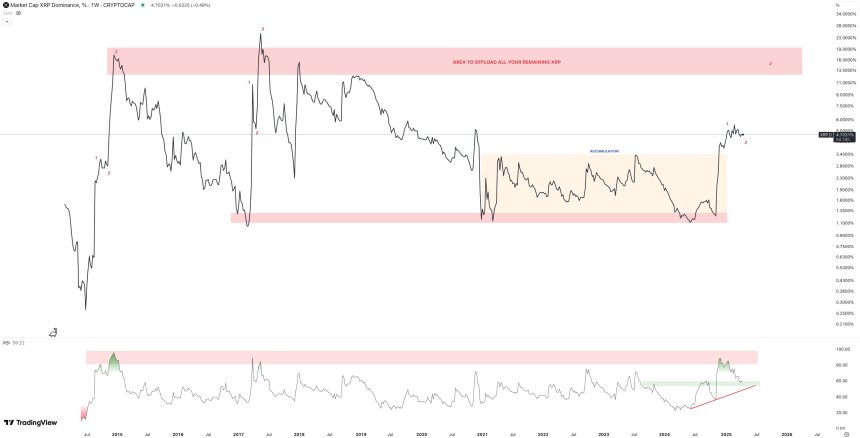
XRP Price Under The Microscope: Top Expert’s Update Sets $10 Target
As the XRP price climbs back above the crucial $2 mark, reflecting a 20% surge over the past week, m...
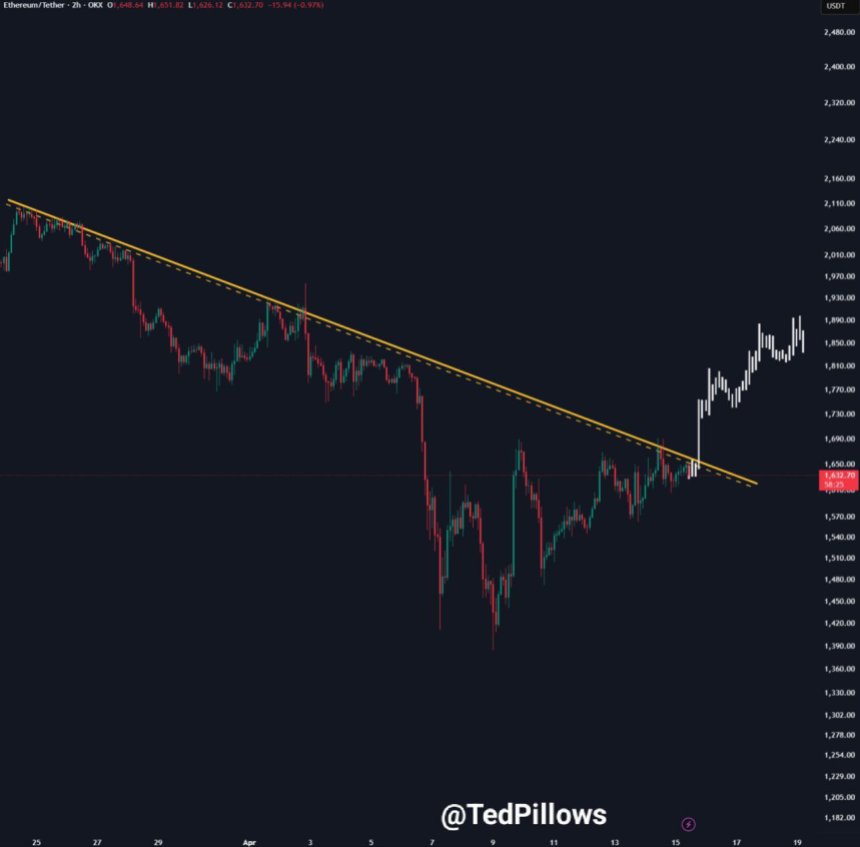
Is The Storm Over For Ethereum? Analyst Says ‘Face-Melting’ Rally Comes Next
Ethereum (ETH) continues to hold a crucial support level after recovering from last week’s correctio...