XRP Price Eyes $2.0 Breakout—Can It Hold and Ignite a Bullish Surge?


XRP price started a fresh increase above the $1.850 resistance. The price is now consolidating and must settle above $2.00 for more gains.
- XRP price started a fresh increase above the $1.850 and $1.950 levels.
- The price is now trading above $1.90 and the 100-hourly Simple Moving Average.
- There was a break above a connecting bearish trend line with resistance at $1.8650 on the hourly chart of the XRP/USD pair (data source from Kraken).
- The pair might extend gains if there is a close above the $2.00 resistance zone.
XRP Price Eyes More Gains
XRP price managed to stay above the $1.750 support zone and started a fresh increase, like Bitcoin and Ethereum . The price climbed above the $1.850 and $1.880 resistance levels.
There was a break above a connecting bearish trend line with resistance at $1.8650 on the hourly chart of the XRP/USD pair. The pair jumped above the $1.950 and $2.00 levels. A high was formed at $2.089 and the price is now correcting gains.
There was a move below the $2.050 level. The price dipped below the 23.6% Fib retracement level of the upward move from the $1.7210 swing low to the $2.0896 high.
The price is now trading above $1.950 and the 100-hourly Simple Moving Average. On the upside, the price might face resistance near the $2.00 level. The first major resistance is near the $2.050 level. The next resistance is $2.0880.
A clear move above the $2.0880 resistance might send the price toward the $2.120 resistance. Any more gains might send the price toward the $2.150 resistance or even $2.20 in the near term. The next major hurdle for the bulls might be $2.320.
Are Dips Limited?
If XRP fails to clear the $2.00 resistance zone, it could start another decline. Initial support on the downside is near the $1.9750 level. The next major support is near the $1.90 level and the 50% Fib retracement level of the upward move from the $1.7210 swing low to the $2.0896 high.
If there is a downside break and a close below the $1.90 level, the price might continue to decline toward the $1.850 support. The next major support sits near the $1.80 zone.
Technical Indicators
Hourly MACD – The MACD for XRP/USD is now losing pace in the bullish zone.
Hourly RSI (Relative Strength Index) – The RSI for XRP/USD is now above the 50 level.
Major Support Levels – $1.9750 and $1.90.
Major Resistance Levels – $2.00 and $2.0880.
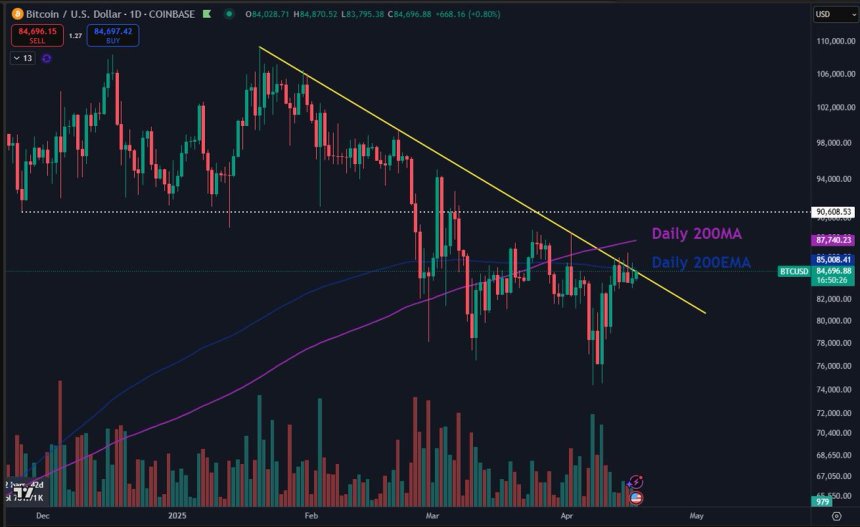
Bitcoin Ready To Reclaim $90,000? BTC’s ‘Next Big Move’ Could Come Next Week
Amid the market volatility, Bitcoin (BTC) has been unable to reclaim the $85,000-$86,000 zone despit...
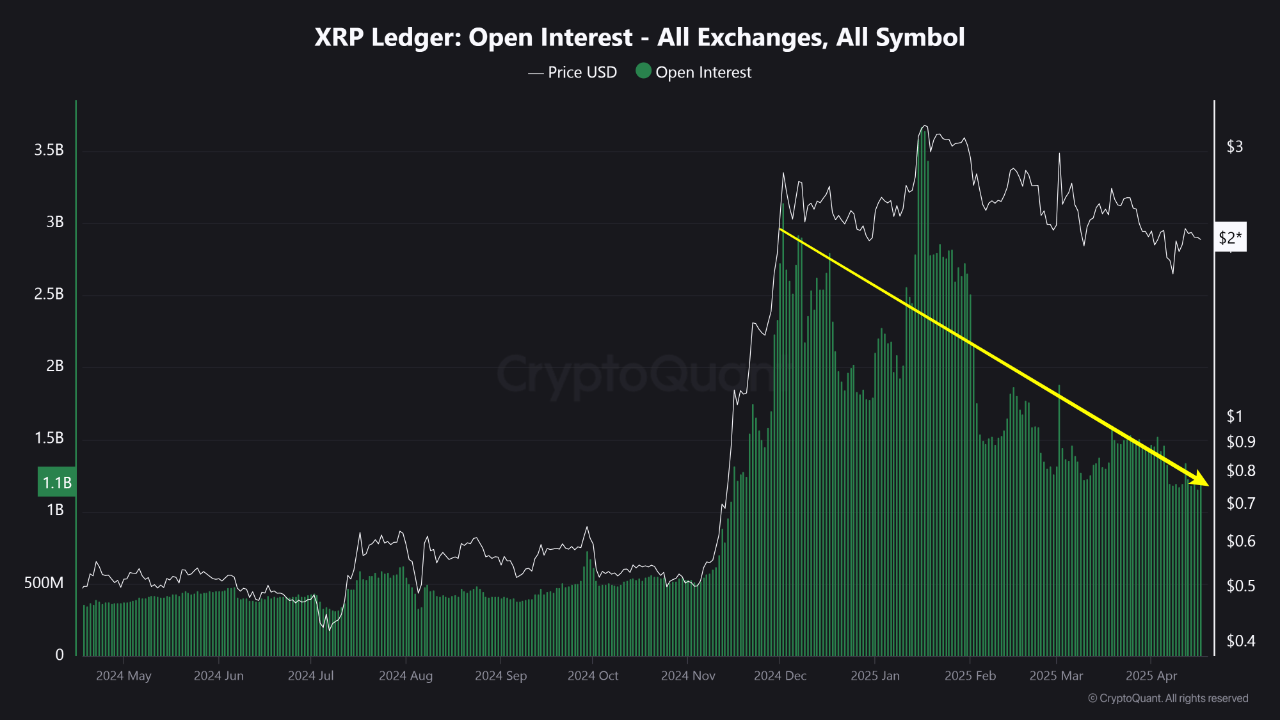
Despite an 18% Drop, XRP’s Exchange Supply Hits Lows—Bullish Setup Ahead?
XRP has been trading under pressure in recent weeks, losing much of the momentum it built during its...
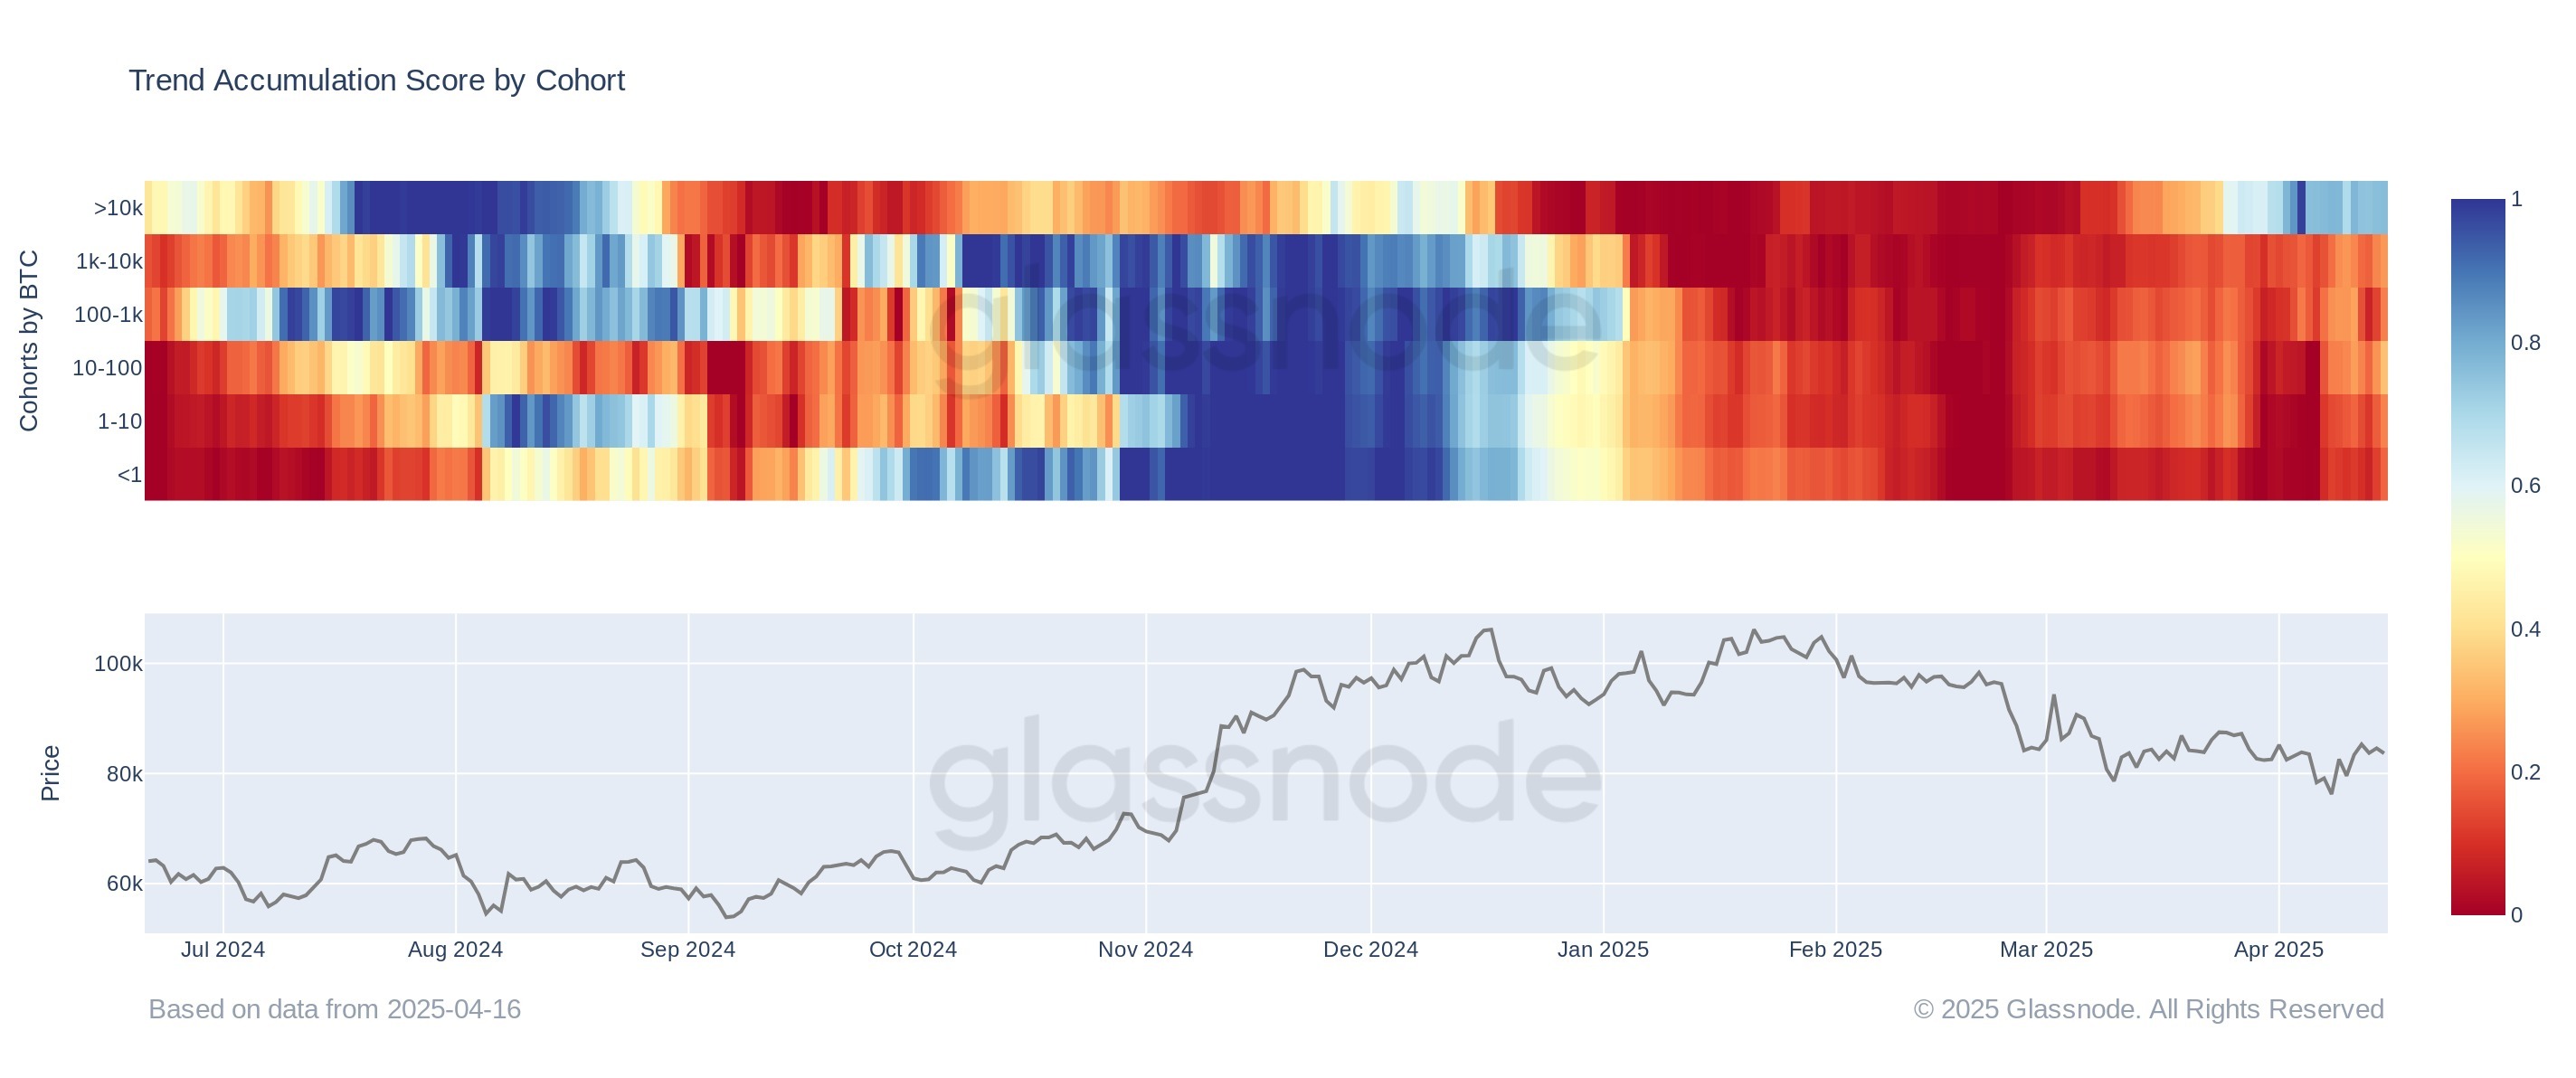
Bitcoin Mega Whales Keep Buying—Is Rest Of Market Finally Catching Up?
On-chain data shows the largest of Bitcoin investors have continued to buy recently. Here’s whether ...