Cardano Shows Signs of Short-Term Rebound


- Cardano is showing a potential reversal signal as the TD Sequential indicator indicates a buy on the daily chart.
- ADA is currently at $0.6608 with the technicals mixed as its market cap edges slightly up.
According to analyst Ali Martinez, Cardano ($ADA) is exhibiting early signs of a possible price rebound . As of press time, ADA was trading at $0.6608, recording an increase of 4.18% from the previous day. This surge came despite a decline of 12.78% in the general market, which stood at $740.91 million.
Technical analysis suggests a change of trend is now possible. Analyst Ali Martinez pointed out that ADA gave a buy signal based on the TD Sequential on the daily time frame. The tool employed in detecting indication exhaustion raised a bullish ‘9’ candle, implying higher price trends. This pattern correlates with recent volatility and bearish pressure that occurred this week when ADA plunged below $0.63.
Bollinger Bands and EMA Positioning
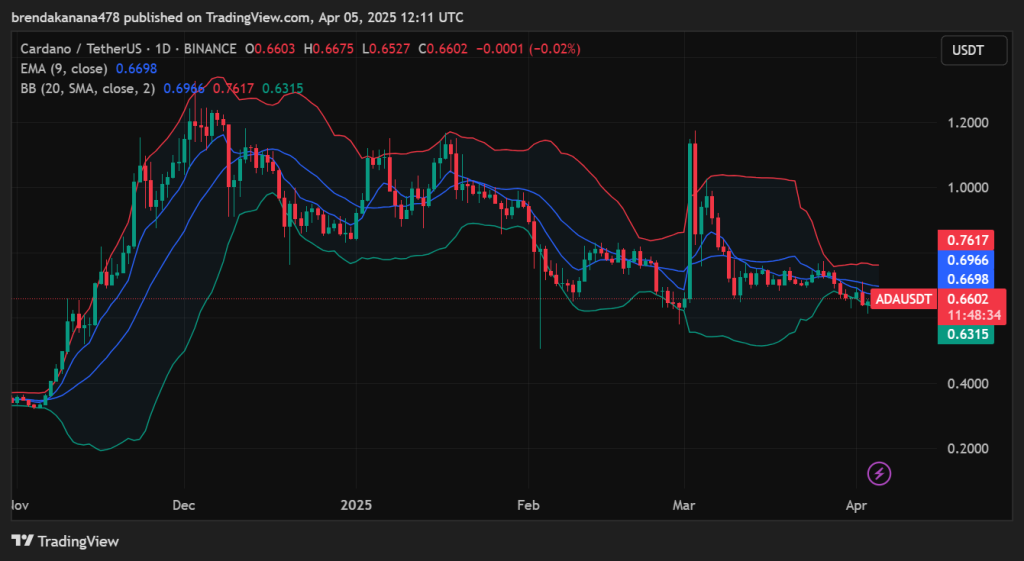
Additionally, the technical data from TradingView shows Cardano’s price is currently in the middle range of its Bollinger Bands. From the Bollinger Band analysis, the upper band is at $0.7617, the middle band (the 20-day simple moving average) is at $0.6966, and the lower band is at $0.6315. The current price of ADA is below the 20-SMA, suggesting that the trend may consolidate and rest here but has the potential to rise if buying pressure is revived.

The 9-day Exponential Moving Average (EMA) is $0.6698, while ADA is traded below this average. A break above the EMA would further open the possibility of a short-term bullish scenario.
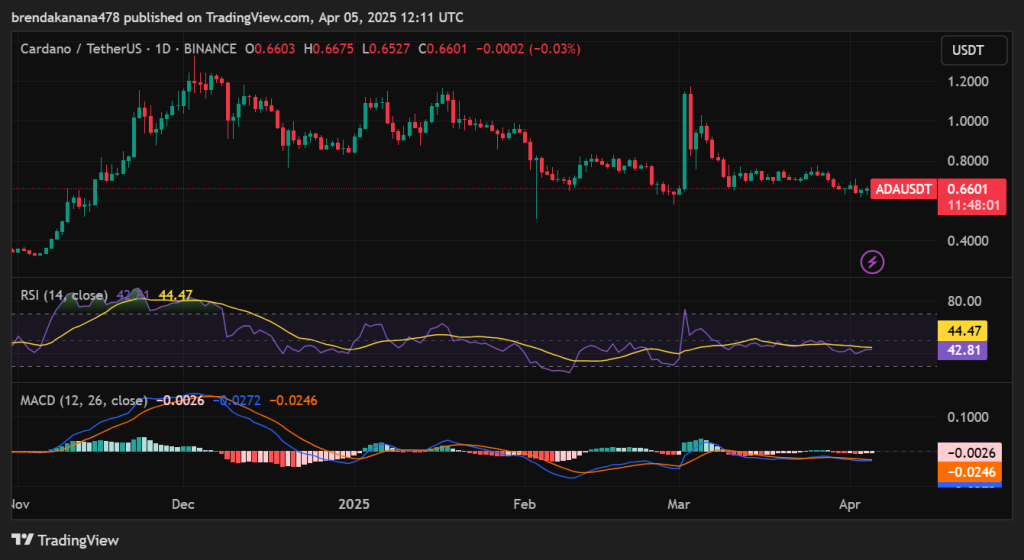
The momentum indicators present a neutral outlook. The Relative Strength Index (RSI) is below the mid-range but slightly above the over-bought zone and currently stands at 44.47. This means that ADA is not overbought or oversold at the current price level.

At the same time, the Moving Average Convergence Divergence (MACD) is slightly bearish. MACD is at -0.0026 below the signal line that is at -0.0246, which shows weak but moderately strengthening momentum.
Analyst Projects Long-Term Upside
Despite these technical signs, Analyst Alex Becker has placed Cardano among eight cryptocurrencies that are likely to deliver 15x returns by 2026. In his latest video, Becker focused on Cardano, noting its speed and decentralized market.
He referred to the ADA blockchain as “fast as hell” and credited its decentralized nature, comparable to Ethereum, as fundamental to its long-term potential. Based on current trends and network fundamentals, Becker projected a long-term price range of $3 to $5 for ADA.

Crypto Market Overview: Severe Downturn Impacts All Prominent Crypto Projects
The crypto market plunged by 8.3% as the Fear & Greed Index hit 23, while Bitcoin ($BTC), Ethereum (...

BigBang DAO Partners with Bitgert to Redfine AI-Driven Decentralization
The collaboration intends to break down the barriers hindering the community development, on-chain i...

DuskPay Launches with PlayMatika and Betpassion, Bringing Instant Payments to Italy’s €150 Billion Gaming Market
Amsterdam, The Netherlands, 7th April 2025, Chainwire...

