XRP Price Consolidates—Breakout Incoming or More Choppy Moves?


XRP price started a fresh recovery wave above the $2.40 zone. The price is now correcting gains from $2.50 and might revisit the $2.35 support.
- XRP price started a fresh recovery wave above the $2.40 resistance zone.
- The price is now trading above $2.40 and the 100-hourly Simple Moving Average.
- There was a break below a connecting bullish trend line with support at $2.430 on the hourly chart of the XRP/USD pair (data source from Kraken).
- The pair might extend losses if it breaks the $2.40 support zone.
XRP Price Trims Gains
XRP price remained supported and started a recovery wave above the $2.320 zone, like Bitcoin and Ethereum . The price was able to clear the $2.40 and $2.420 resistance levels.
The bulls were able to push the price above the 50% Fib retracement level of the downward wave from the $2.580 swing high to the $2.354 low. The price even tested the $2.50 resistance. However, there was no upside continuation and the price reacted to the downside.
There was a break below a connecting bullish trend line with support at $2.430 on the hourly chart of the XRP/USD pair. The price is now trading above $2.40 and the 100-hourly Simple Moving Average.
On the upside, the price might face resistance near the $2.450 level. The first major resistance is near the $2.480 level. The next resistance is $2.50 or the 61.8% Fib retracement level of the downward wave from the $2.580 swing high to the $2.354 low.
A clear move above the $2.50 resistance might send the price toward the $2.550 resistance. Any more gains might send the price toward the $2.650 resistance or even $2.6650 in the near term. The next major hurdle for the bulls might be $2.80.
More Losses?
If XRP fails to clear the $2.480 resistance zone, it could start another decline. Initial support on the downside is near the $2.40 level. The next major support is near the $2.350 level.
If there is a downside break and a close below the $2.350 level, the price might continue to decline toward the $2.320 support. The next major support sits near the $2.250 zone.
Technical Indicators
Hourly MACD – The MACD for XRP/USD is now losing pace in the bullish zone.
Hourly RSI (Relative Strength Index) – The RSI for XRP/USD is now below the 50 level.
Major Support Levels – $2.40 and $2.350.
Major Resistance Levels – $2.480 and $2.50.
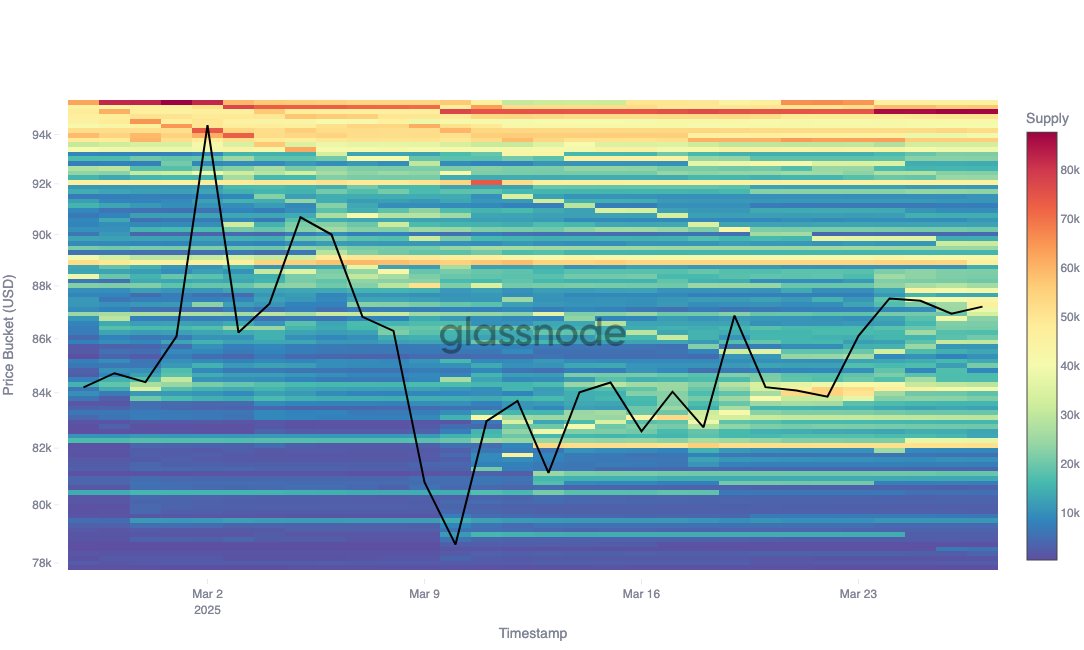
Bitcoin Price Slips Under $84,000 — Key Support Levels To Watch
The Bitcoin price put in one of its strongest performances in recent times over the past week, rally...
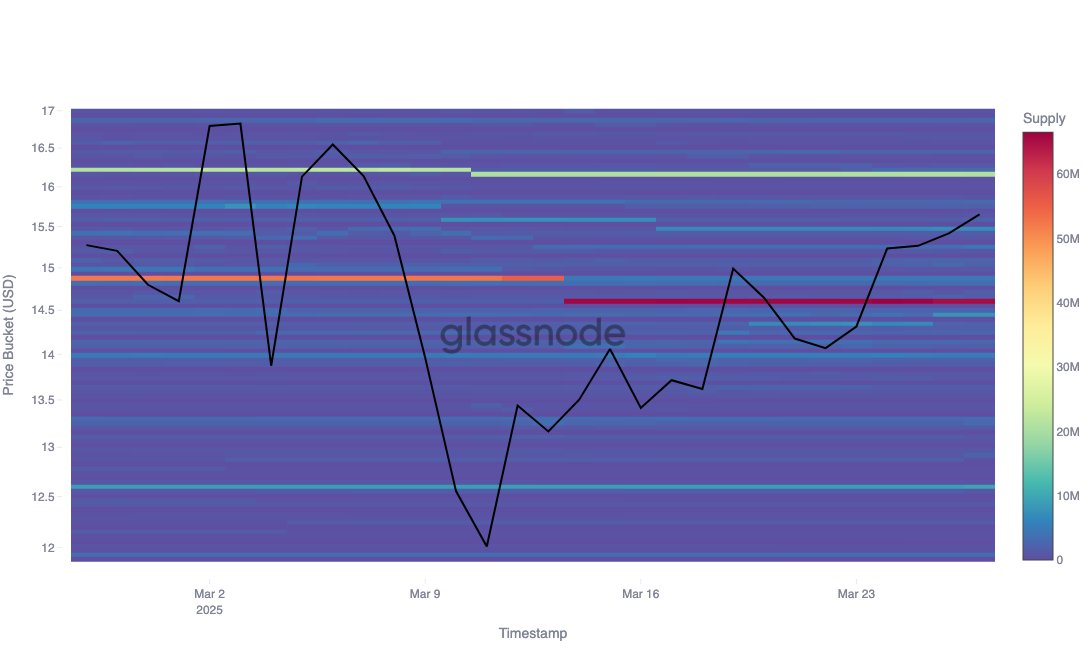
Support Or Resistance? Chainlink (LINK) Investor Data Suggests Key Price Zones
Market prices of Chainlink (LINK) suffered another major decline in the past 24 hours as the general...
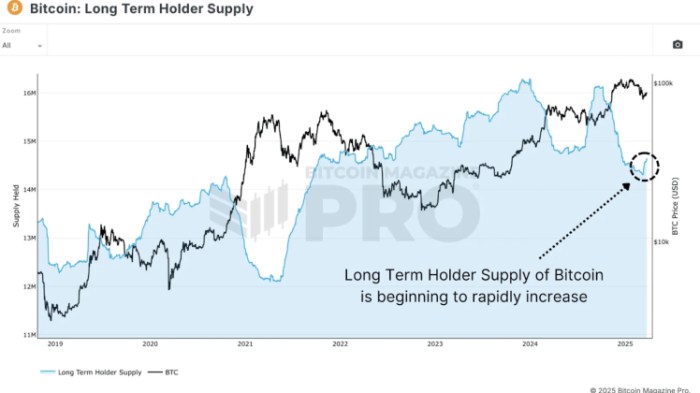
Best New Meme Coins on Presale as Bitcoin Nears Next Bull Run
Bitcoin’s recent dip from an all-time high of $109K all the way to $77K rattled a lot of retail inve...