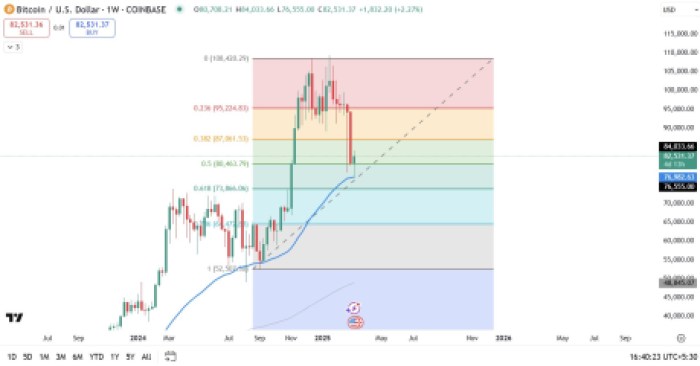
XRP Price Eyes Upside Break—Can Bulls Push Through Resistance?


XRP price started a fresh recovery wave from the $1.90 zone. The price is now showing positive signs and might clear the $2.250 resistance zone.
- XRP price started a fresh decline from the $2.200 resistance zone.
- The price is now trading below $2.1850 and the 100-hourly Simple Moving Average.
- There is a short-term rising channel forming with resistance at $2.250 on the hourly chart of the XRP/USD pair (data source from Kraken).
- The pair might continue to move up if it clears the $2.250 resistance zone.
XRP Price Dips Further
XRP price started a fresh decline after it failed to clear the $2.20 zone, like Bitcoin and Ethereum . The price declined below the $2.120 and $2.050 support levels.
The bears even pushed the price below $2.00. A low was formed at $1.90 and the price recently started a decent upward move. There was a move above the $1.980 and $2.00 resistance levels. The price surpassed the 50% Fib retracement level of the downward wave from the $2.365 swing high to the $1.90 low.
The price is now trading below $2.1850 and the 100-hourly Simple Moving Average. On the upside, the price might face resistance near the $2.250 level. There is also a short-term rising channel forming with resistance at $2.250 on the hourly chart of the XRP/USD pair.
The 76.4% Fib retracement level of the downward wave from the $2.365 swing high to the $1.90 low is also near the $2.250 level. The first major resistance is near the $2.350 level.
The next resistance is $2.420. A clear move above the $2.420 resistance might send the price toward the $2.450 resistance. Any more gains might send the price toward the $2.50 resistance or even $2.550 in the near term. The next major hurdle for the bulls might be $2.650.
Another Decline?
If XRP fails to clear the $2.250 resistance zone, it could start another decline. Initial support on the downside is near the $2.150 level. The next major support is near the $2.120 level.
If there is a downside break and a close below the $2.120 level, the price might continue to decline toward the $2.050 support. The next major support sits near the $2.00 zone.
Technical Indicators
Hourly MACD – The MACD for XRP/USD is now losing pace in the bearish zone.
Hourly RSI (Relative Strength Index) – The RSI for XRP/USD is now above the 50 level.
Major Support Levels – $2.120 and $2.050.
Major Resistance Levels – $2.250 and $2.350.
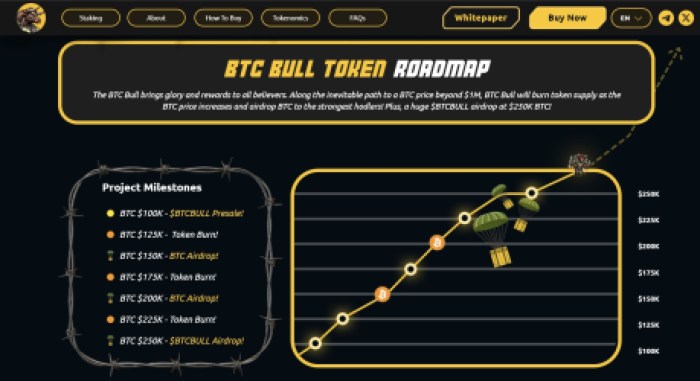
Solo Bitcoin Miner Earns 3.15 Bitcoins — You Can Earn Free $BTC Too With BTC Bull Token Airdrops
A solo miner hit what many are calling a jackpot, as he mined a Bitcoin block #887,212 with just a 4...

XRP Crashing? Analyst Sounds Alarm On Looming Price Threat
An analyst is expressing apprehension regarding the price movement of XRP, cautioning that the crypt...
Why Is Crypto Down Today, Best Crypto to Buy as Canada Tariffs Eased
Donald Trump has decided not to double tariffs on Canadian aluminum and steel, offering a sigh of re...