Top Bitcoin Inflows Hit Year-High on Binance – Should You Be Concerned?


Bitcoin’s price continues its decline, falling farther from its March all-time high of $109,000. Currently trading below $82,000, the cryptocurrency has experienced a significant 24.6% drop.
Amid this bearish trend, CryptoQuant contributor EgyHash has highlighted a troubling development on Binance that could further pressure Bitcoin’s price.
Bearish Sentiment Takes Hold
EgyHash notes that Binance, one of the world’s largest crypto exchanges, is seeing a steady rise in key metrics that indicate growing sell-side activity . According to EgyHash, the 7-day moving average of mean coin inflows into Binance is increasing, signaling that investors are making larger, more frequent deposits.
This uptick in inflows often precedes heightened selling activity , as it suggests that more coins are becoming available on the exchange’s order books.
Adding to this, the “Bitcoin: Exchange Inflow (Top10)” metric—an indicator that tracks the total coin volume of the top ten largest inflow transactions—has reached levels not seen in almost a year. This surge suggests that significant amounts of Bitcoin are being moved onto Binance , potentially with the intent to sell.
EgyHash also points out that Binance’s Bitcoin reserves are climbing, returning to levels last observed in November of the previous year. A rise in exchange reserves typically reflects an increase in coins held by the platform, which can signal more selling pressure.
Bearish Signals on Binance? Key Metrics Point to Rising Sell Pressure
“Binance’s Bitcoin reserve has risen to levels last observed in November of the previous year, potentially indicating more selling pressure.” – By @EgyHashX
Read more
https://t.co/vl4sDIxaKD pic.twitter.com/y7qB1D4IS1
— CryptoQuant.com (@cryptoquant_com) February 28, 2025
Further supporting this view is the Taker Buy/Sell Ratio, which reveals that sell orders currently outweigh buy orders, painting a bearish picture for the market.
This accumulation of factors—rising inflows, growing exchange reserves, and a dominant bearish sentiment—could indicate that Bitcoin’s downward trajectory may continue.
Examining the Role of Unrealized Profit and Loss (NUPL)
While sell pressure on exchanges is a significant factor, other indicators are offering a broader perspective on the market’s overall sentiment.
Another CryptoQuant analyst, tugbachain, recently discussed the Net Unrealized Profit/Loss (NUPL) metric, which tracks the network’s unrealized profits and losses to determine whether investors, on average, are holding Bitcoin at a gain or a loss.
According to tugbachain, the NUPL currently sits just below the 0.50 support level. Historically, a reading below this threshold has coincided with bearish phases , while a recovery above it can suggest renewed buying interest.
If Bitcoin’s monthly close for February exceeds this 0.50 mark, it could indicate a shift toward more optimistic price action, possibly encouraging long-term holders to re-enter the market.

Featured image created with DALL-E, Chart from TradingView

Bitcoin Nears $76,000 Target Amid Price Correction — But Will This Support Hold?
Over the past week, Bitcoin has experienced a strong market correction with prices falling as low as...
BTC Bull Presale an Excellent Opportunity to Buy the Dip amid Bitcoin Correction
Bitcoin flirted around with the magic $100K number for a couple of months before selling off and fal...
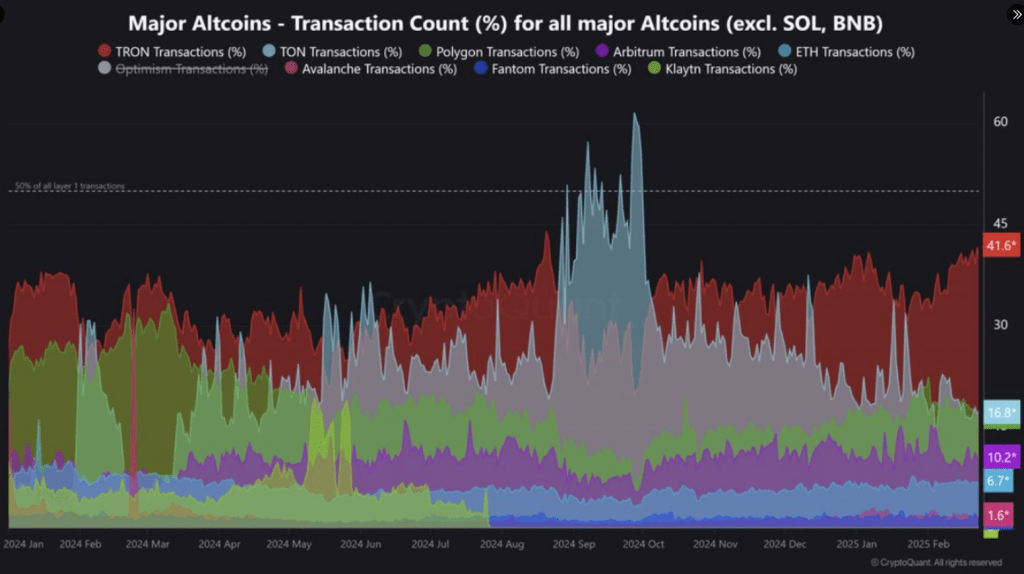
Altcoin Transaction King? TRON Hits 42% Share As USDT, DeFi Explode
Tron (TRX) is demonstrating its status as a dominant force in the realm of altcoin transactions. The...