Daily Market Review: BTC, ETH, FTT, TRUMP, LTC


The bulls are in total control in today’s session, as seen from the increase in the global market cap. The total cap stood at $3.24T as of press time, representing a 0.93% increase over the last 24 hours, while the trading volume dropped by 30% over the same period to stand at $118.18B as of press time.
Bitcoin Price Review
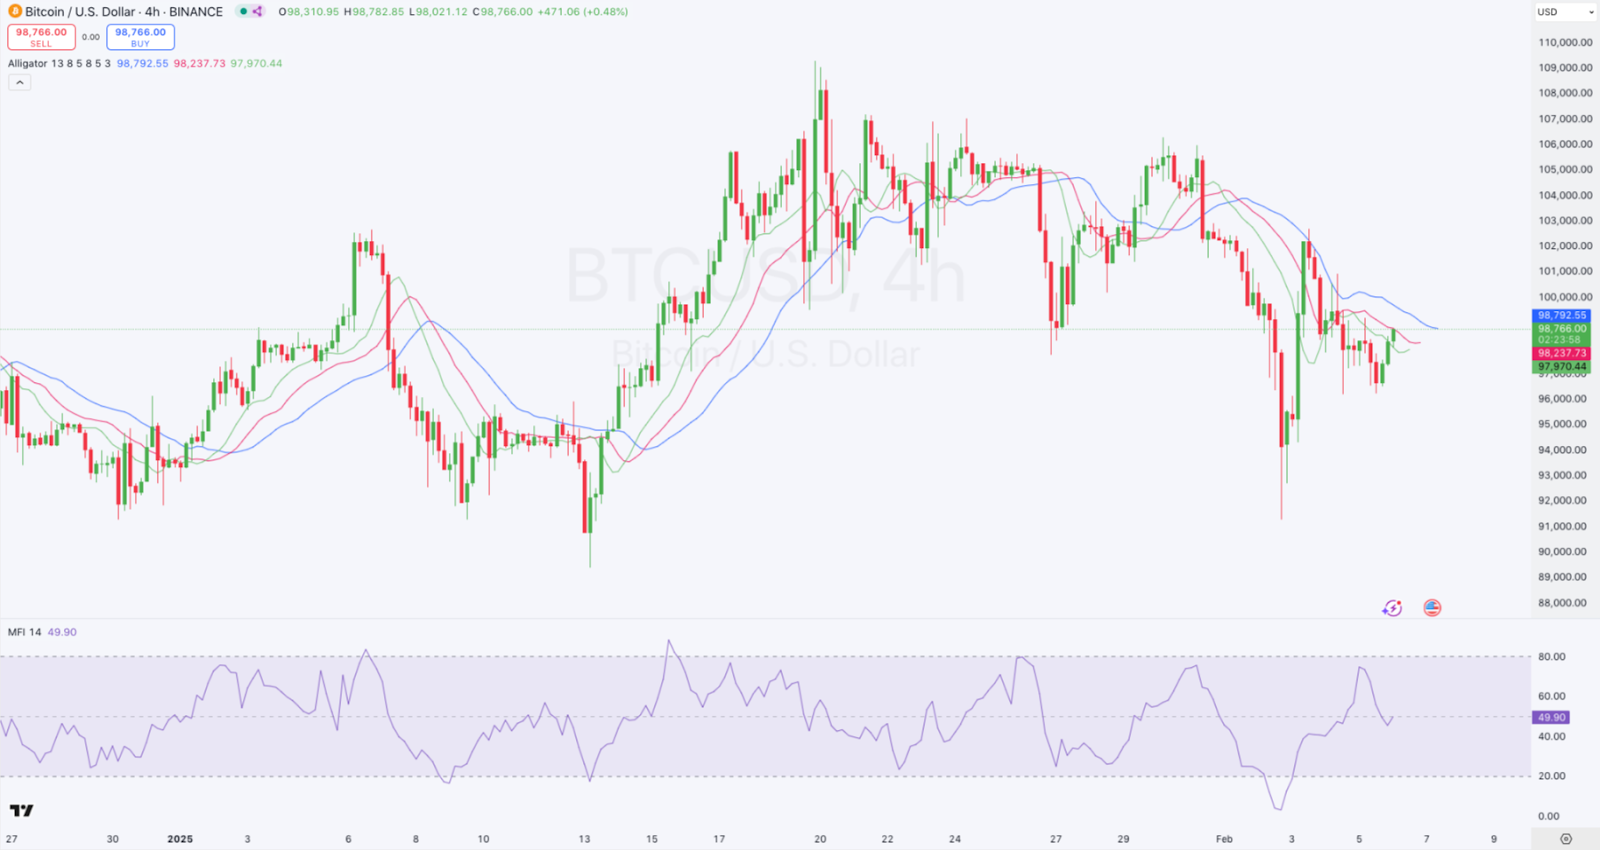
Bitcoin, $BTC , is posting gains in today’s session, as seen from its price movements. Looking at an in-depth analysis, we see that Bitcoin is trading around $98,766, with resistance near $98,792 (Alligator’s blue line). BTC has been moving in a choppy range, with a recent downtrend but signs of a potential reversal. The moving averages are beginning to converge, which could signal consolidation before a move.
On the other hand, we see that the MFI is at 49.90, it’s neutral, suggesting no strong momentum. Bitcoin traded at $98,585 as of press time, representing a 1.25% increase over the last 24 hours.
Ethereum Price Review
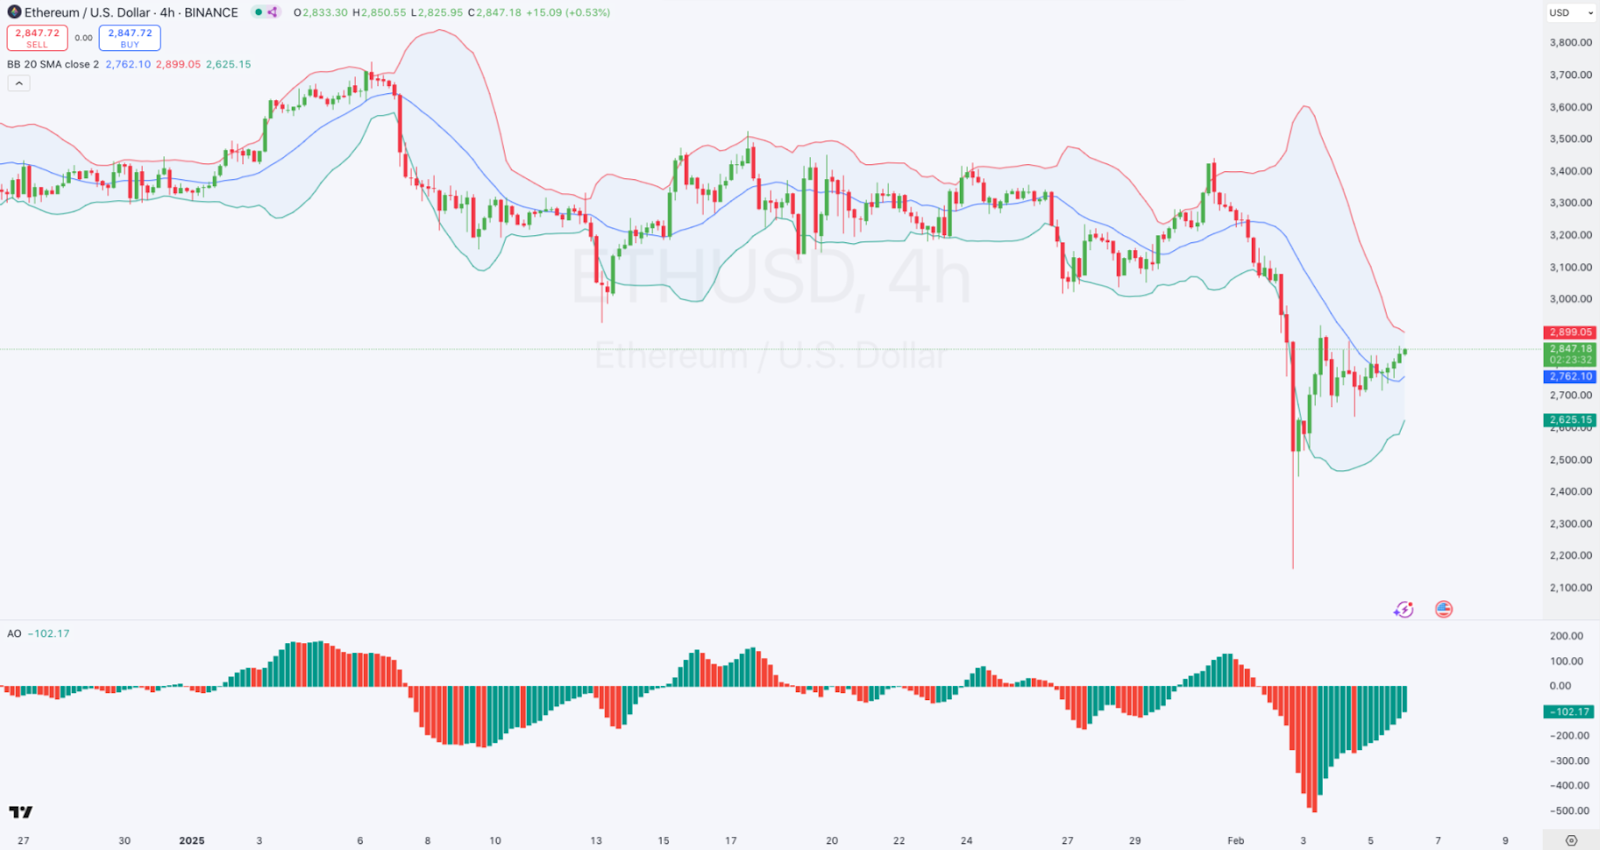
Ethereum, $ETH , is also among the gainers in today’s session as also seen from its price movements. Looking at an in-depth analysis, we see that ETH is trading at $2,847, testing the mid-Bollinger Band. The price recently bounced from the lower Bollinger Band (~$2,625) and is attempting a recovery. Volatility is present, but ETH is moving towards the upper band (~$2,900).
On the other hand, we see that the Awesome Oscillator (AO) is showing signs of bullish divergence, indicating possible short-term upward movement. Ethereum traded at $2,843 as of press time, representing a 3,46% increase over the last 24 hours.
FTX Token Price Review
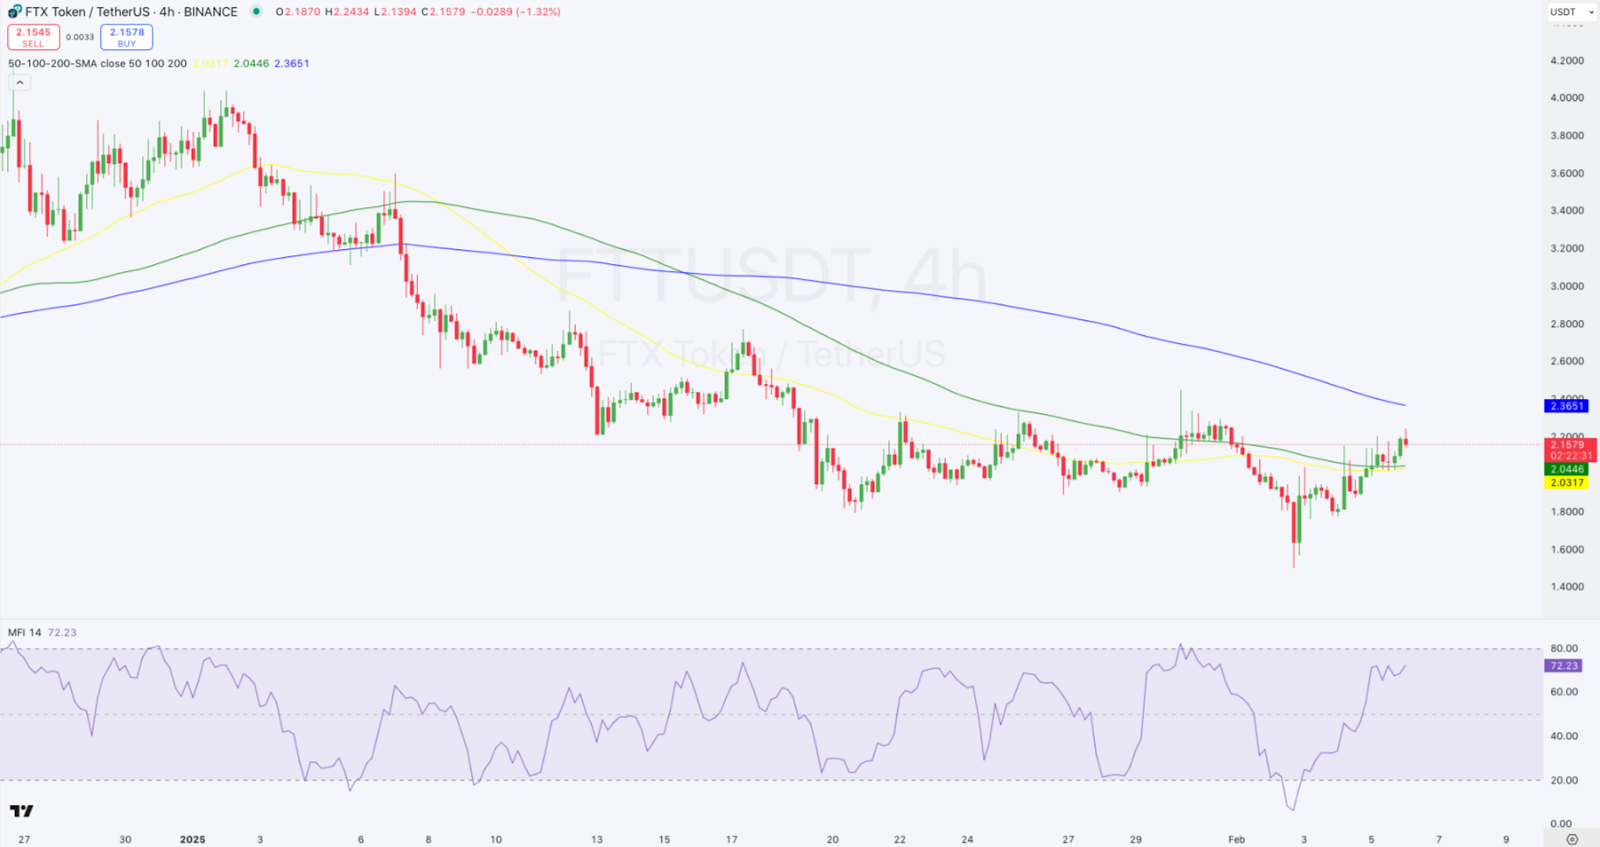
FTX Token, $FTT, has emerged among the day’s top gainers as seen from its price movements. Looking at an in-depth analysis we see that trading at $2.15, near the 50-SMA resistance (~$2.03). FTT is trying to break above its moving averages, which are acting as resistance. The 200-SMA (~$2.36) is a key resistance level.
On the other hand we see that the MFI is at 72.23, approaching overbought territory, signaling potential correction. FTX Token traded at $2.16 as of press time, representing a 7.84% increase over the last 24 hours.
OFFICIAL TRUMP Price Review
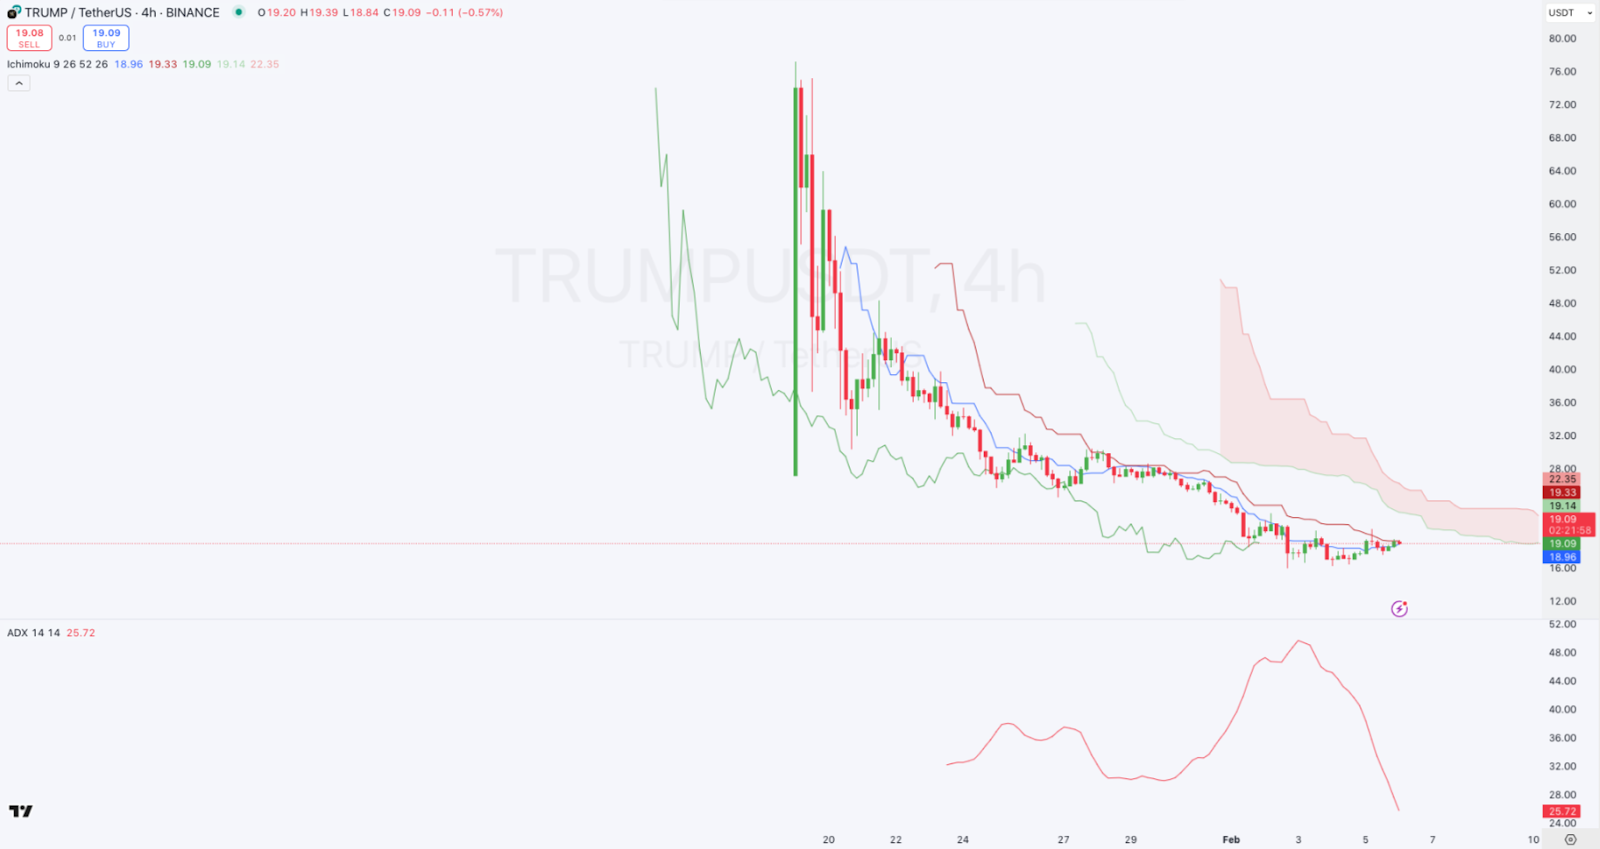
OFFICIAL TRUMP, $TRUMP, is also among the top gainers in today’s session as also seen from its price movements. Looking at an in-depth analysis, we see that the token is trading at $19.09, consolidating after a sharp downtrend. The price remains below the Ichimoku Cloud, indicating a bearish trend. Resistance at $22.35, with no clear bullish signs yet.
On the other hand, we see that the ADX is at 25.72, showing weak trend strength. OFFICIAL TRUMP traded at $18.97 as of press time, representing a 4.82% increase over the last 24 hours.
Litecoin Price Review
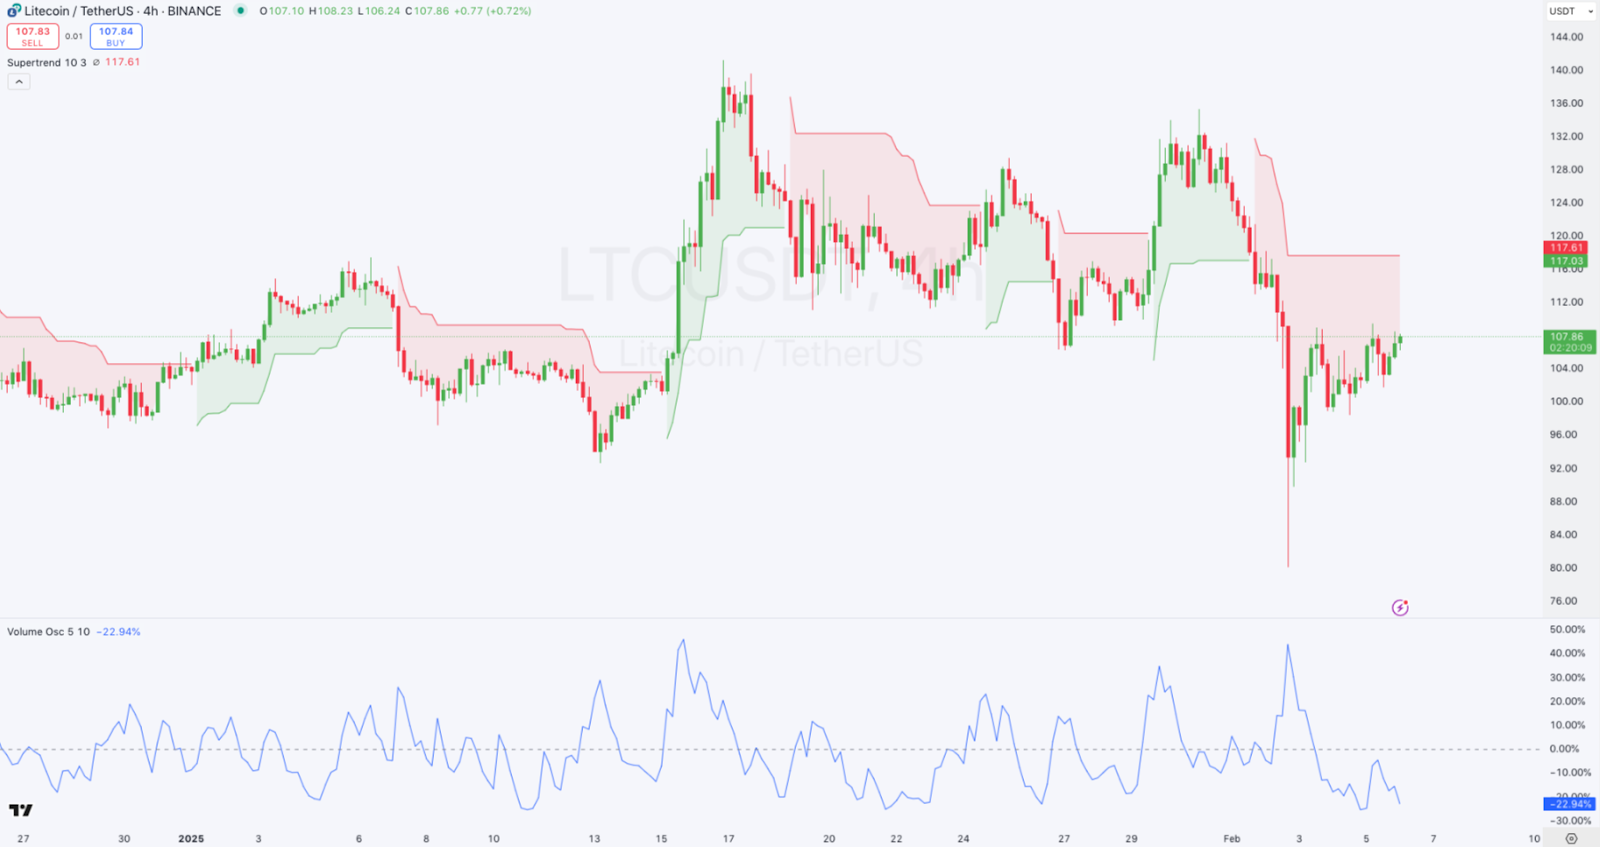
Litecoin, $LTC, is also among the gainers in today’s session as also seen from its price movements. Looking at an in-depth analysis, we see that the token is trading at $107.86, facing resistance at $117.61. LTC is bouncing from a recent low, attempting a recovery. The Supertrend shows a bearish trend still dominant unless price clears $117.61.
On the other hand, looking at other indicators, we see that the Volume Oscillator is at -22.94%, indicating weak buying volume. Litecoin traded at $108.43 as of press time, representing a 5.06% increase over the last 24 hours.

Aptos Sees Surge in Active Addresses, Daily Transactions, & DeFi TVL in Second Half of 2024
Aptos recorded a significant increase in DeFi TVL, daily active addresses, crypto transactions, and ...

Ika Reveals Strategic Investment From Sui Foundation, Bringing Total Funding to Over $21m
Zug, Switzerland, 28th April 2025, Chainwire...

Shocking $FARTCOIN Move: Trader Spends $563K to Reload $FARTCOIN Bags
The trader who earned $4.9 million from $FARTCOIN trading has entered the market again. LookOnChain ...

