Ethereum Forms Complex iH&S Structure, Why $18,000 Is The Possible Target


Ethereum (ETH) is showing signs of a bullish breakout, forming a complex Inverse Head and Shoulder (iH&S) pattern on the weekly timeframe. This key technical formation suggests that the Ethereum price is on track for a massive rally toward a bullish target of $18,000.
Ethereum Forms Inverse Head & Shoulder Pattern
The Ethereum price has been in a long consolidation period , experiencing a crash amid the ongoing market turmoil. Despite recording massive declines that have pushed its value significantly below all-time highs, crypto analyst Gert van Lagen on X (formerly Twitter) predicts that ETH could still reach a price target of $18,000.
Notably, Ethereum recently bounced off the $1,800 – $2,000 support range, which previously served as resistance during the ‘Head’ phase of the iH&S pattern. With this crucial retest confirmed, ETH may be entering the final stage of its reversal, set up to new all-time highs.
Lagen’s $18,000 bullish target is more than 8X Ethereum’s current price, underscoring the sheer magnitude of this projection. Lagen has identified the formation of the iH&S structure on the Ethereum chart, supporting his ambitious prediction with this renowned bullish chart pattern.
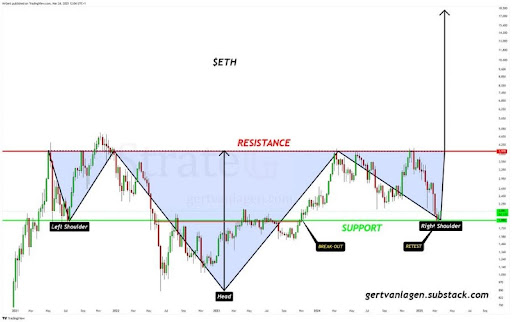
The Inverse Head and Shoulder is a classic bullish reversal structure, often signaling the end of a downtrend and the beginning of a strong and new uptrend. Considering the Ethereum’s price has been in a downturn , the formation of the iH&S chart pattern suggests that this prolonged decline may be finally coming to an end.
In the analyst’s chart, this left shoulder of the iH&S structure began forming from 2021 to 2022, experiencing a price peak before a pullback. From 2022 to 2023, a deeper decline occurred, marking the cycle low and the formation of the ‘Head.’ Finally, the right shoulder of the technical pattern was formed between 2024 to 2024, recording a higher low that aligned with the left shoulder.
Lagen’s price chart highlights that the most critical level to watch is the neckline of the iH&S structure, which is approximately $3,978 and acts as the primary resistance area .
How An $18,000 ETH Target Is Possible
Still looking at Lagen’s Ethereum price chart , the analyst suggests that if ETH can surpass the $3,978 resistance level with strong volume, it could validate the Inverse Head and Shoulder pattern and open the door for a rally toward $18,000. Conversely, if Ethereum fails to break above this resistance level, a prolonged consolidation or significant pullback may occur before its next breakout attempt.
Lagen predicts that a rejection at the resistance area could see the Ethereum price drop to $1,888 — an important support level which could prevent further declines. A drop to this support would represent a potential 52% dip from the main resistance level and an 8.52% decline from ETH’s current market value of $2,055.


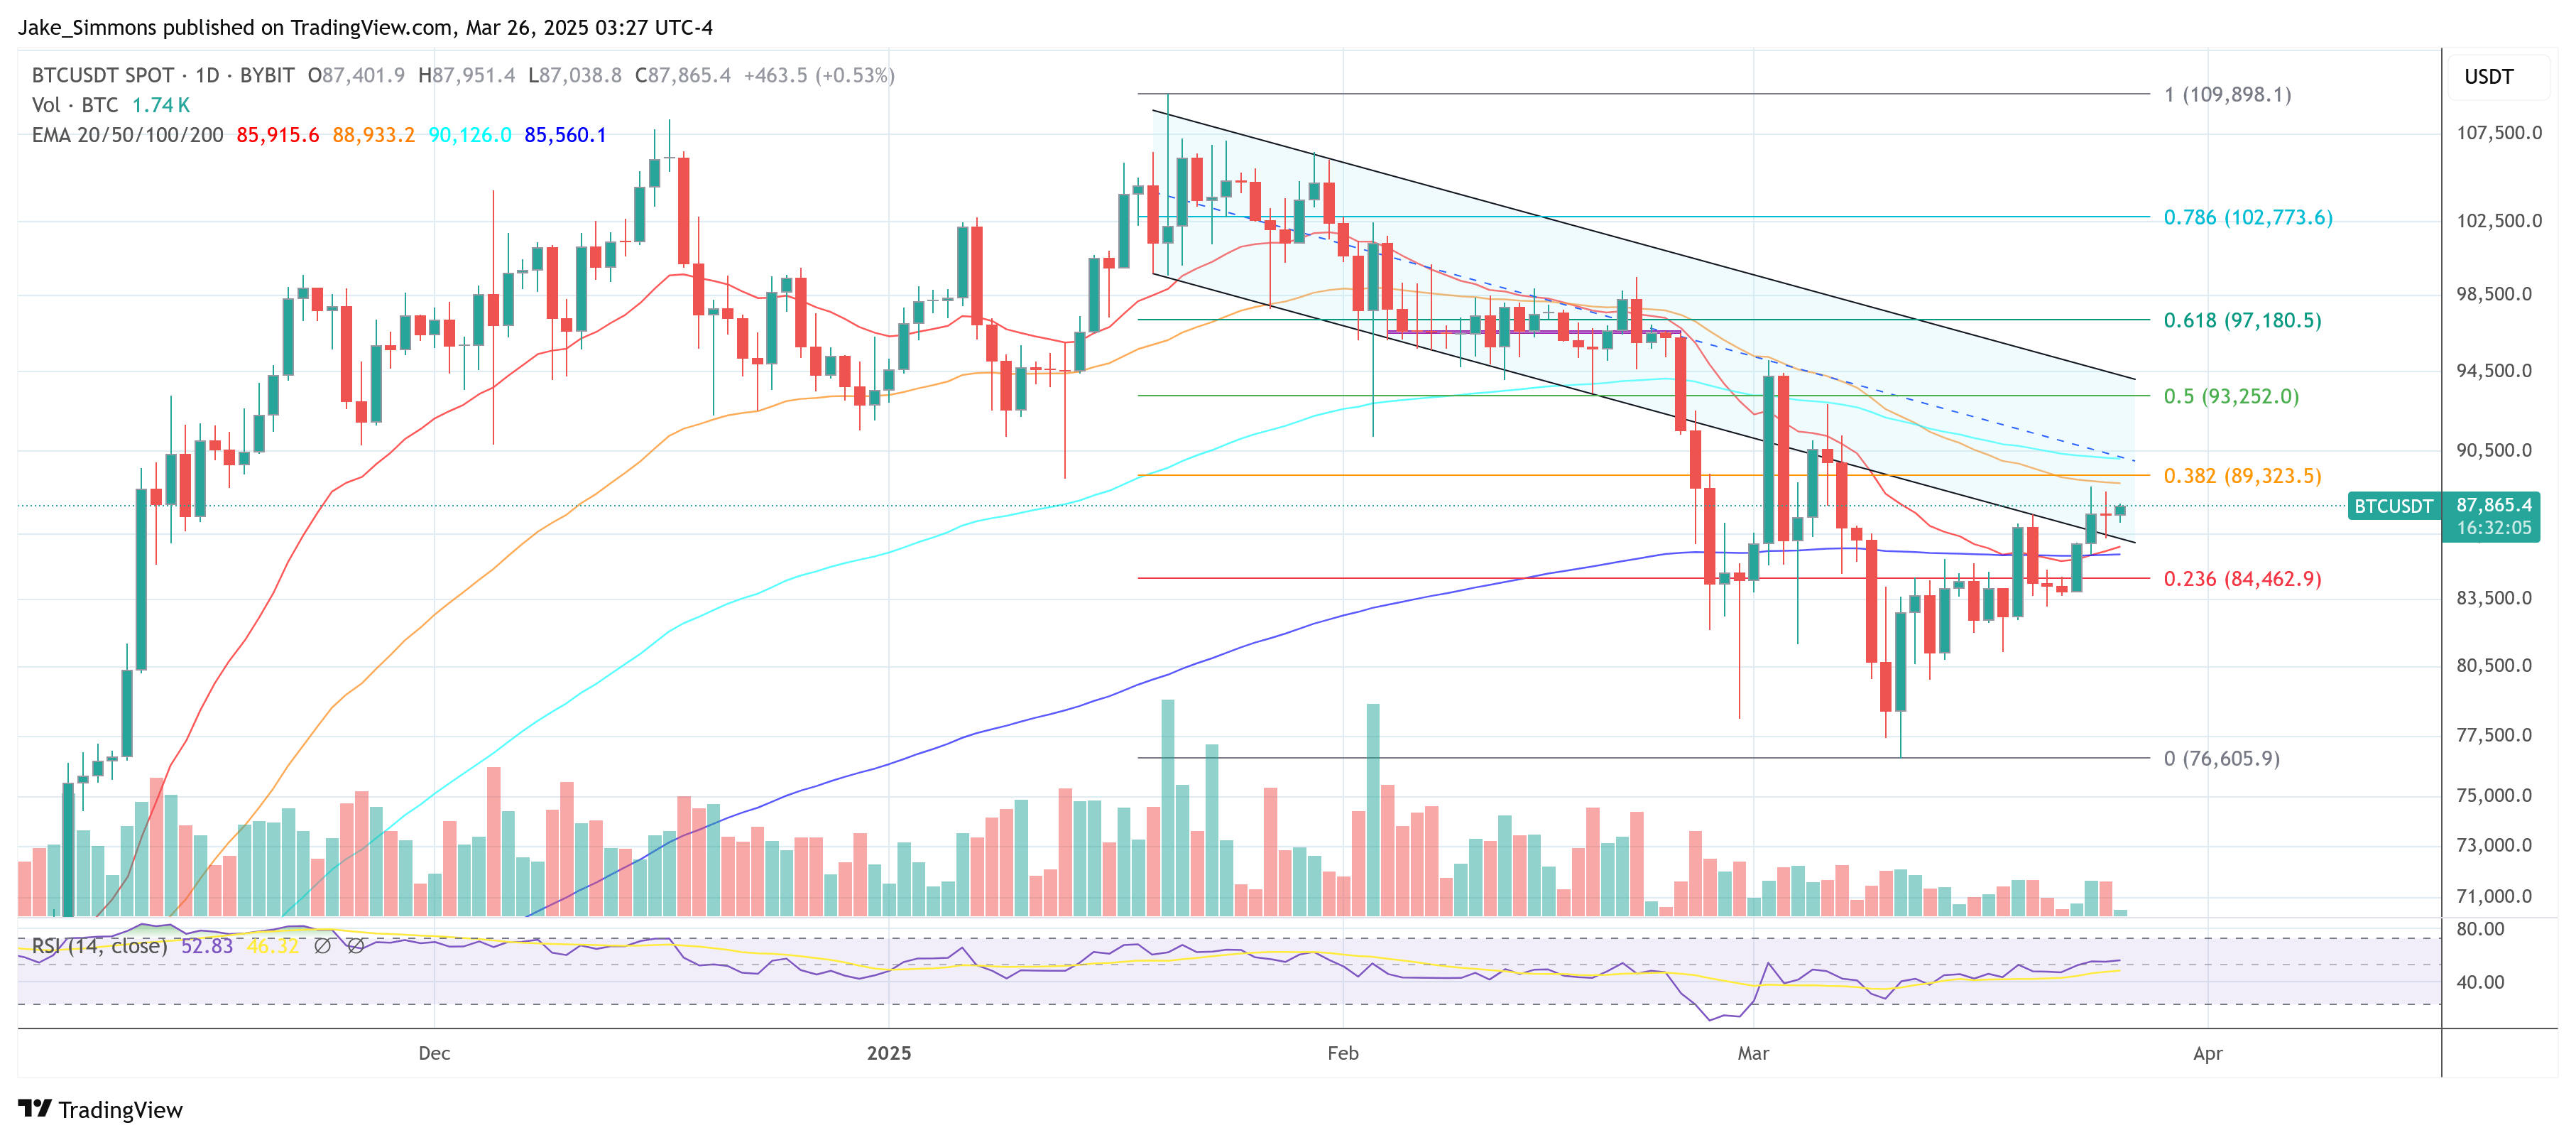
Bitcoin Rally To $95K? Market Greed Suggests It’s Possible
Bitcoin is on everyone’s crosshairs once more. The cryptocurrency shot up to $88,500 today, exciting...
Now Is The Best Time To Buy Bitcoin, Says Investment Giant
In its latest investor memo, titled “The Great Derisking of Bitcoin,” Bitwise Asset Management has t...

GameStop Board Unanimously Approves Bitcoin As Treasury Reserve Asset
In a significant move for the video game retail giant, GameStop announced on Tuesday that its board ...