Dogecoin (DOGE) Plots Comeback—Is The Meme Coin Gearing Up for a Move?


Dogecoin started a fresh decline below the $0.1720 zone against the US Dollar. DOGE tested $0.1650 and is now attempting to recover toward $0.180.
- DOGE price started a fresh decline below the $0.1750 and $0.1720 levels.
- The price is trading above the $0.170 level and the 100-hourly simple moving average.
- There is a connecting bullish trend line forming with support at $0.1680 on the hourly chart of the DOGE/USD pair (data source from Kraken).
- The price could gain bullish momentum if it clears the $0.1750 and $0.1800 resistance levels.
Dogecoin Price Eyes Recovery
Dogecoin price started a fresh decline below the $0.1750 zone, like Bitcoin and Ethereum . DOGE dipped below the $0.1720 and $0.1700 support levels. It even spiked below $0.1650.
A low was formed at $0.1646 and the price is now attempting a strong comeback. There was a move above the $0.1680 level. The bulls pushed the price above the 50% Fib retracement level of the downward move from the $0.1791 swing high to the $0.1646 low.
Dogecoin price is now trading above the $0.1680 level and the 100-hourly simple moving average. There is also a connecting bullish trend line forming with support at $0.1680 on the hourly chart of the DOGE/USD pair.
Immediate resistance on the upside is near the $0.1755 level or the 76.4% Fib retracement level of the downward move from the $0.1791 swing high to the $0.1646 low. The first major resistance for the bulls could be near the $0.1780 level.
The next major resistance is near the $0.1800 level. A close above the $0.1800 resistance might send the price toward the $0.1850 resistance. Any more gains might send the price toward the $0.2000 level. The next major stop for the bulls might be $0.2050.
More Losses In DOGE?
If DOGE’s price fails to climb above the $0.1755 level, it could start another decline. Initial support on the downside is near the $0.1720 level. The next major support is near the $0.1680 level.
The main support sits at $0.1650. If there is a downside break below the $0.1650 support, the price could decline further. In the stated case, the price might decline toward the $0.1620 level or even $0.1550 in the near term.
Technical Indicators
Hourly MACD – The MACD for DOGE/USD is now losing momentum in the bearish zone.
Hourly RSI (Relative Strength Index) – The RSI for DOGE/USD is now above the 50 level.
Major Support Levels – $0.1680 and $0.1650.
Major Resistance Levels – $0.1755 and $0.1800.
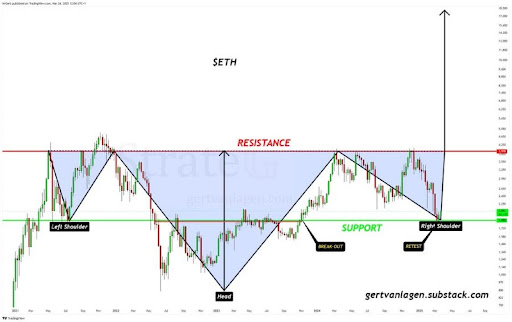
Ethereum Forms Complex iH&S Structure, Why $18,000 Is The Possible Target
Ethereum (ETH) is showing signs of a bullish breakout, forming a complex Inverse Head and Shoulder (...
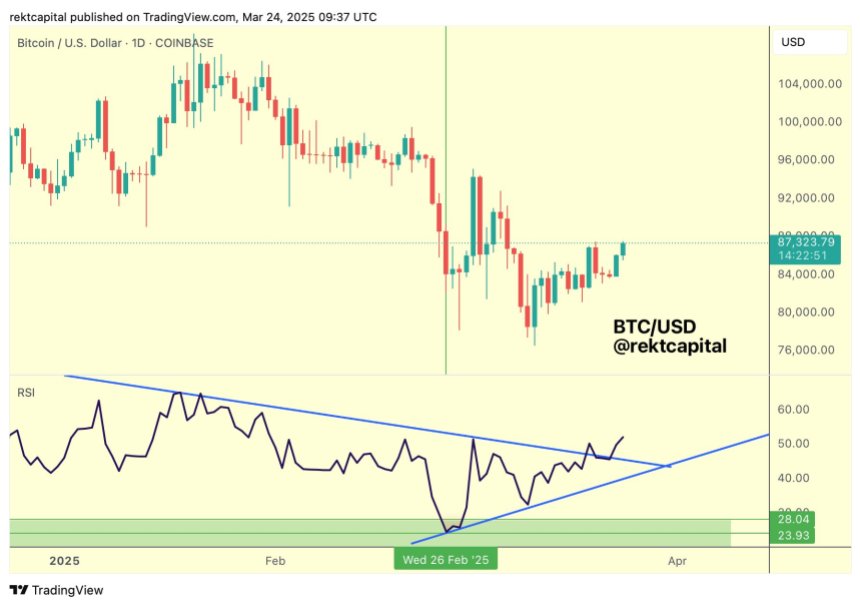
Bitcoin Breaks Daily RSI Downtrend, But Analyst Warns Of Strong Resistance Ahead
After hitting a low of nearly $76,000 on March 10, Bitcoin (BTC) has finally broken its daily Relati...

Dogecoin Is ‘All Going To Plan,’ Says Crypto Analyst
Crypto analyst Kevin has provided an update on Dogecoin’s price structure, highlighting how multiple...