



Bitcoin is currently priced around $84,000, and the market's response to this level offers deeper insight into its current condition than any single news story.
The asset has faced a series of negative pressures in recent weeks: heightened tensions in Iran, a shift toward a more aggressive stance from the Federal Reserve, ongoing outflows from ETFs, and a liquidation event that wiped out over $190 million in leveraged positions.
Still, it has remained resilient , holding above the $77,000 support level that would confirm a more severe bearish outlook.
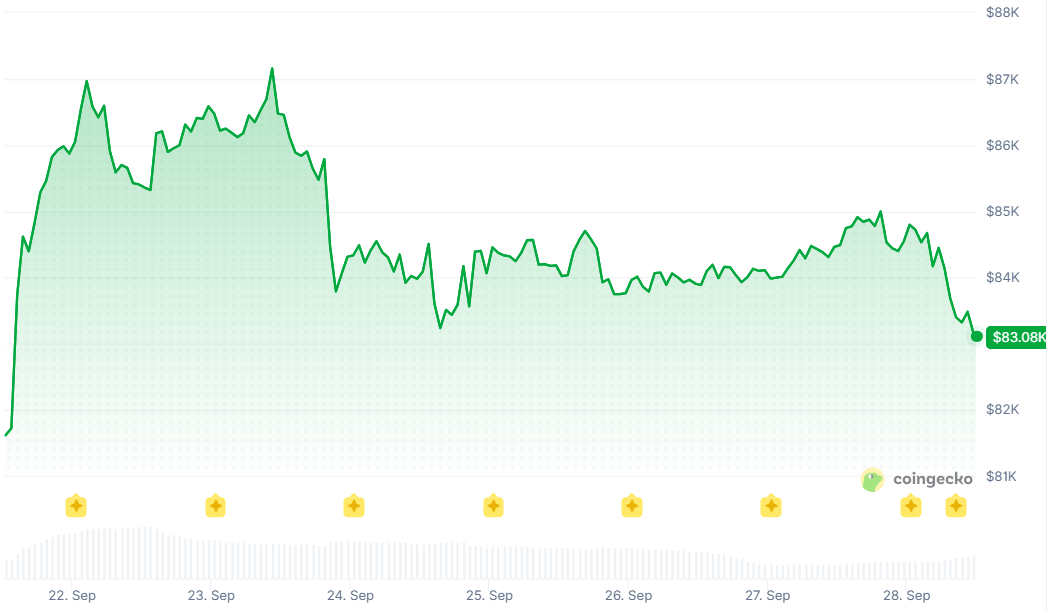
It shows that Bitcoin ownership dynamics, motivations, and the actions people are willing to take in response to a difficult macroeconomic climate have changed significantly.
The Macro Overhang: War, Inflation, and a Fed That Won’t Blink
Markets have been impacted by global unrest since late February, which is the direct cause of Bitcoin's recent volatility.
Every asset class now has a consistent risk premium due to the four-month-long war between the US, Israel, and Iran .
Despite President Trump's claims about U.S. dominance over the Strait of Hormuz, international shipping is still unable to travel through the narrow waterway that supplied about 20% of the world's oil before the conflict.
Iran has proposed a seven-day plan to reopen the canal in exchange for the lifting of sanctions and the thawing of frozen assets.
Nevertheless, Trump has categorically rejected the idea , calling it "unacceptable."
There have been major monetary policy consequences as well.
A notable 17.9% spike in energy costs was a major factor in April's Consumer Price Index's 3.8% year-over-year increase.
The biggest notable increase since April 2023 was the 4.2% surge in May's print .
The market's expectation of many Fed rate cuts at the beginning of 2025 has been shattered by the abrupt change.
The dollar has strengthened, and risk asset liquidity has decreased as a result of the growing belief that the Federal Reserve will hike rates in 2026 rather than cut them.
Bitcoin's relationship with the Nasdaq has been prominently evident .
When Trump suggested further strikes on Iran earlier this week, both Bitcoin and Nasdaq futures experienced a decline simultaneously - a clear indication that during times of heightened risk aversion, cryptocurrency behaves more like a volatile tech asset rather than a safe haven.
The ETF Reversal: From $4.4 Billion Exodus to Tentative Stabilization
The behavior of US spot Bitcoin ETFs has been the most important institutional signal throughout this cycle.
A substantial outflow of almost $4.4 billion occurred between the middle of June and the end of May in these vehicles, leading to a negative net flow for the year thus far.
Inflation, which makes interest rate cuts less justified, a strong dollar, and the additional geopolitical risk premium were the dominant macroeconomic variables that impacted all risk assets and contributed to the departure.
There was some respite last week.
A net of $227.5 million was removed from US spot Bitcoin ETFs during the week that ended on June 19.
This is an improvement over the multi-billion-dollar losses of the past few weeks, but it's still a negative position overall.
On June 18, BlackRock's IBIT saw withdrawals of $96.7 million while MSBT saw inflows of $10.4 million; the daily granularity gives important details. Rather than being uniformly pessimistic, this shows that institutional sentiment is fractured.
New evidence paints a more positive picture.
According to Glassnode , after two weeks of net withdrawals, US spot Bitcoin ETFs have received about $1.3 billion in the five trading days since the current price pressure began.
The latest showed the greatest single inflow since the beginning of July.
Institutional investors are seeing the $77,000–$84,000 area as an opportunity to accumulate rather than sell, and this turnaround coincides with the price stabilizing above $84,000.
On-Chain Signals: A Shallower Bear Than It Feels
An inherent paradox of the present market is revealed by the on-chain data . This decrease should be seen as catastrophic by multiple measures.
From its all-time high of $126,000 in October 2025 to its all-time low of $58,000 in June, a fall of 53%, Bitcoin underwent a substantial slump.
During June, long-term holders mainly liquidated their coins at a loss, since the Spent Output Profit Ratio (SOPR) remained below 1 for 27 out of 30 days.
But overall, the effect on the cost basis has been milder than in past cycles.
Despite the bad market, Bitcoin has continued to close each day above its realized price, which represents the total cost basis of all investors, according to statistics from Glassnode.
Even at its June low, it was higher than that mark.
The percentage of supply that is profit fell to a level similar to that seen at the June low and the bottom of 2022.
While NUPL (Net Unrealized Profit/Loss) fell sharply into negative territory in 2018 and 2022, it stayed positive for the whole cycle .
The main differentiating feature is the absence of a systemic collapse.
The forced liquidations of LUNA, Three Arrows, and FTX, among others, triggered the 2022 bear market.
There has been no such diffusion of impact on this cycle . There have been just three instances since 2019 when the combined 30-day growth of spot and perpetual futures demand was around -650,000 BTC.
Having said that, the structural leverage that used to amplify downturns is much reduced now.
The Technical Setup: $84,000 as the Battleground
Importantly, the $84,000 level serves as a baseline .
Located between $84,000 and $85,000, it represents the largest local supply cluster for long-term holders.
We may see a direct path to the average MVRV price of $96,700 if we stay above this level.
If prices fall below this level, the $77,000 mark, which has limited price increases for most of 2026, will once again be considered.
And if the price of crude fell below $77,000, the term "shallow bear market" would have no meaning.
These limitations are solidified by the options market.
According to Deribit's data, positive gamma is found between the present spot price and $92,000, while negative gamma is located around the $95,000 mark.
In other words, as the price gets closer to the average MVRV zone, dealer hedging slows it down, but accelerates it up in the lower band.
This means that $84,000 acts as a pivot point, with price fluctuations below it amplified and those toward $92,000–$95,000 subdued.
To hedge against possible drops, market participants have been deliberately adjusting their positions .
On Deribit, there has been a noticeable uptick in the buying of put options, with notable acquisitions including the $60,000 and $55,000 expiry puts on July 3 and the $52,000 puts on July 31.
These aren't bets on a catastrophic collapse; rather, they're protections against the extremely unlikely event that the war with Iran were to intensify or the Federal Reserve were to raise interest rates more sharply than expected.
The Bull Case: A Rare Divergence and Drying Supply
There is a very encouraging sign in the technical picture .
While the price of Bitcoin hit lower lows, the relative strength index (RSI) for the cryptocurrency showed higher lows, indicating that selling pressure has decreased.
This is the second bullish divergence that the RSI has ever formed.
After Bitcoin hit a low of about $15,500 in November 2022 and then climbed over 700% to $126,200, the most recent sign appeared after the FTX collapse .
The 50-week moving average , which is currently at approximately $91,800, is seen by trend watchers as the first major objective, with the subsequent resistance level being located above $100,000.
Throughout the three bear markets that occurred in 2015, 2018, and 2020, the 200-week moving average—which is currently hovering around $62,000—consistently served as an essential support level.
Indicators from the supply side point to a bright future in the medium run.
Though almost all short-term investors are currently making money, the weekly profit-taking during the current recovery is still a minor amount compared to the peaks witnessed in 2024 and 2025.
Historically, this pattern of action has indicated the possibility of extended upward moves, but holders are not quickly turning the rally into exit liquidity.
More than tripling from its August low, spot volume across exchanges has risen 121% since the recovery began, indicating a substantial surge.
Every time volume increased between 2025 and 2026, it was during a declining trend, suggesting a period of capitulatory selling.
As the value of Bitcoin continued to rise, August signaled a change from the previous trend and emerged as the first spike of the year.
The Path Forward: Three Scenarios, One Threshold
The immediate market movement is contingent upon three things: the outcome of the Iran crisis, the decisions to be made by the Federal Reserve, and the sustainability of ETF inflows following their recent upturn.
A positive scenario resulting in $90,000–$100,000 depends on a nuclear agreement between Iran and its neighbors, which would stabilize oil prices, lower inflation estimates in the summer, and sustain investment in exchange-traded funds.
There is still not enough conviction about this scenario, even though the market is prepared for it according to the bullish divergence and falling put demand.
Assuming management of tensions, continued high inflation, and no major interest rate hikes by the central bank, a base case of $80,000 to $84,000 is put forward.
Within the constraints of the current situation, this stands as the most direct course of action.
If $50,000 were to be the predicted drop , the Federal Reserve would have to either keep raising interest rates or escalate the current battle.
Instead of implying that this is the main expected outcome, buying puts at the $52,000-$60,000 strikes shows a strategy to reduce risk in light of this possibility.
Around $77,000 is the critical mark. Keeping one's position above it guaranties that the market framework put in place after 2022 remains stable.
If this level were to drop below this one, it would put the claim that this cycle is essentially different from others to the test.
An unbalanced market is indicated by a Bitcoin price of $84,000.
The market is currently holding its breath as it processes macroeconomic disruptions, with institutional investors quietly amassing assets and long-term investors remaining stable and reluctant to sell.
That patience will be either rewarded or further tested depending on what happens with Iran and the Federal Reserve meeting in September.
What Other Technical Readings Show
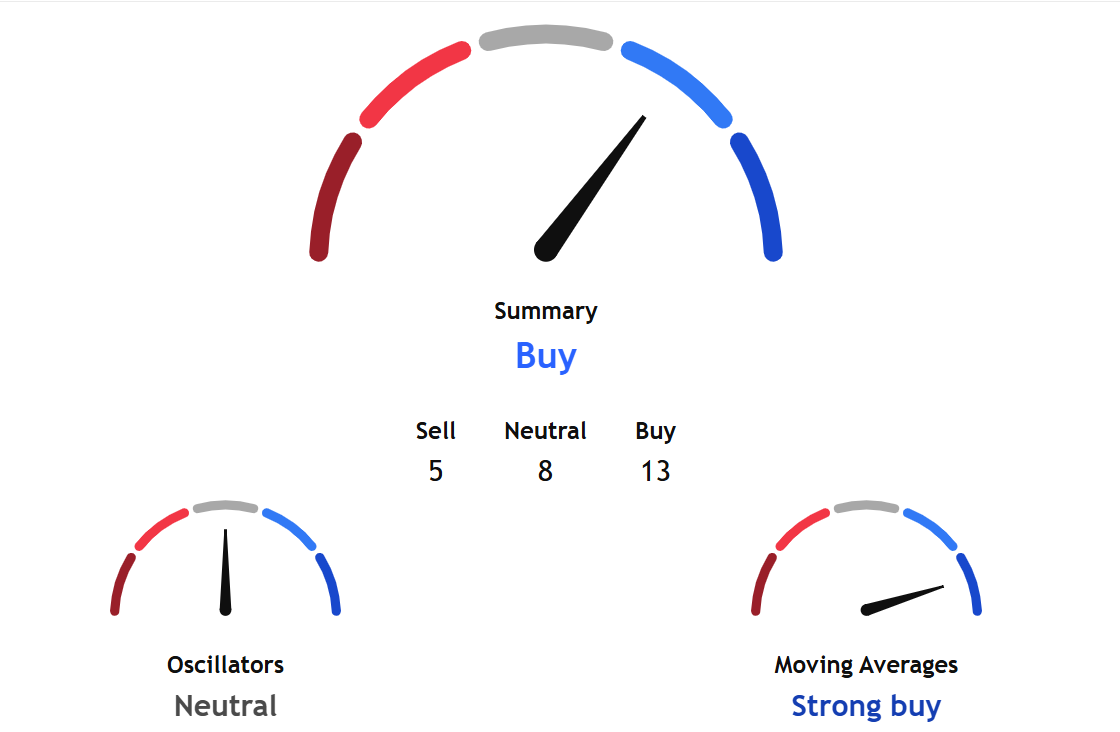
TradingView's technical analysis overview for the coming week based on key data from moving averages, oscillators, and pivots showed a buy signal.
While sub-gauges under the oscillators measuring short-term technical outlook showed a neutral stance, the long-term sub-indicators under moving averages pointed to a strong buy signal.
Separately, InvestTech's Algorithmic Overall Analysis gave a weak positive signal.
The research noted, "Investors have paid higher prices over time to buy Bitcoin, and the currency is in a rising trend channel in the short term. This signals increasing optimism among investors and indicates continued rise."
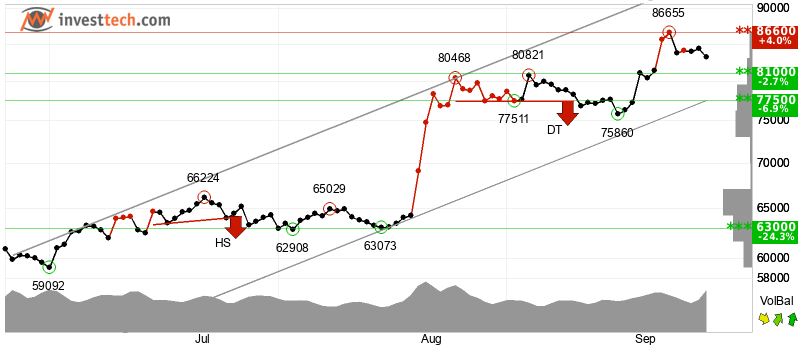
InvestTech added, "The currency has support at points 81000 and resistance at points 86600. The currency is assessed as technically positive for the short term."