
The post Bitgert (BRISE) Price Surges 130%—But Could This be Just a Liquidity-Driven Rally? appeared first on Coinpedia Fintech News
The Bitgert (BRISE) price has exploded by over 130% in a sudden move that’s turning heads across the market. The token surged from the lows around $0.0000000174, marking the monthly high at $0.00000004117, outperforming the slightly down broader market. But beneath the surface, the rally raises more questions than answers.
With no clear catalyst and a sharp spike in on-chain activity appearing almost overnight, traders are now facing a familiar dilemma—is the current price the start of a real breakout or just another low-cap liquidity grab?
On-Chain Data Signals Sudden Activity — Not Steady Growth
Bitgert’s on-chain data shows a synchronised surge across multiple key metrics, pointing to a sudden burst of network activity rather than gradual growth. New transactions recorded a sharp vertical spike after weeks of relatively muted movement, while active accounts followed a similar pattern with a late-stage jump. At the same time, contract growth increased in step-like bursts, indicating discrete waves of interaction rather than continuous expansion.
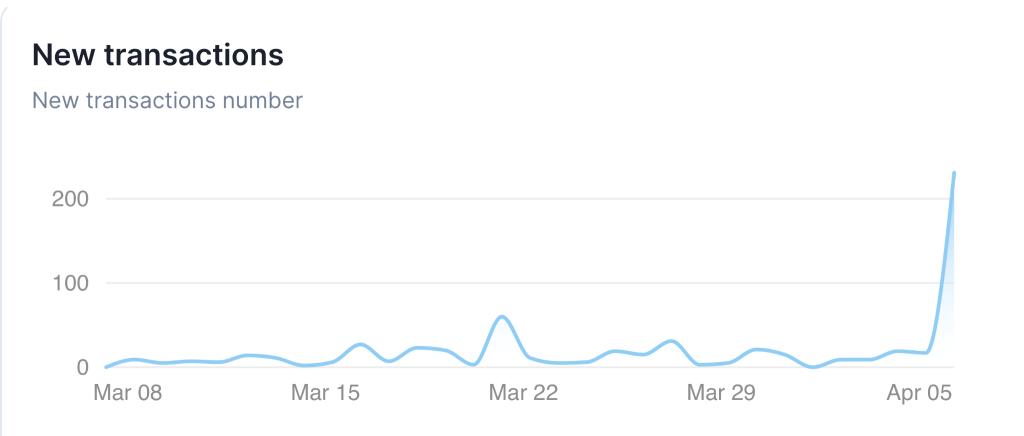
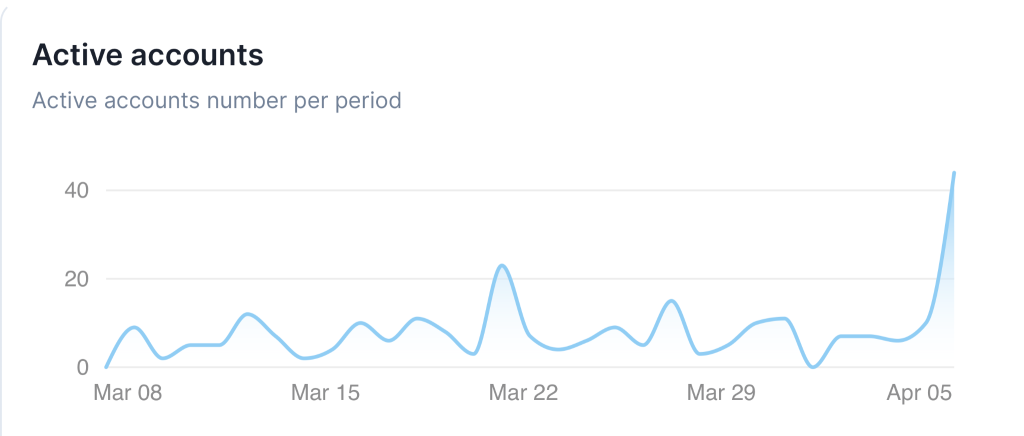
Taken together, this pattern suggests that the recent activity is concentrated within a short time window, not built through sustained user adoption. Such synchronized spikes across transactions, users, and contracts are often associated with short-term participation, including speculative trading flows or coordinated network interactions— rather than organic ecosystem growth. If this activity doesn’t last, it’s more likely to be a short-term spike in usage than a long-term change in demand.
Price Structure Remains Weak Despite Sharp Rally
Bitgert (BRISE) has surged over 130% on the week, pushing the price back toward a critical supply zone near 0.17e⁻⁶. However, the broader structure remains bearish, with price still trading below a long-term descending trendline that has capped rallies since 2023. The current move appears to be a relief bounce from the 0.04e-6 base, rather than a confirmed trend reversal.
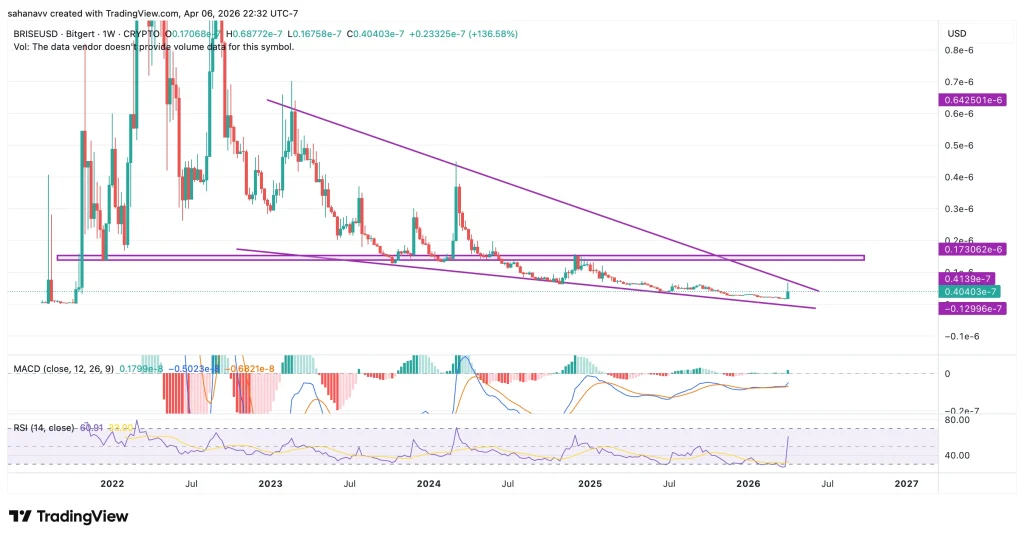
From a momentum standpoint, RSI has bounced from the 30–35 zone to near 60, signaling short-term strength, while MACD is attempting a bullish crossover after an extended bearish phase. But both indicators are still in early-stage recovery and require price confirmation.
Key Levels to Watch
- Immediate Resistance: 0.17e-6
- Breakout Confirmation: Sustained move above 0.17e-6
- Upside Targets (if breakout holds): 0.30e-6 → 0.40e-6
- Support Zone: 0.04e-6 – 0.06e-6
A clean breakout and hold above 0.17e-6 could trigger momentum continuation toward 0.30e-6, with extension potential to 0.40e-6 if volume follows. Rejection at 0.17e-6 would confirm this as a relief rally, with downside risk back toward 0.06e-6 and possibly the 0.04e-6 base. If the price fails to hold above 0.10e⁻⁶ after the spike, it signals weakening momentum and increases the probability that this move was liquidity-driven rather than structural.
Wrapping it Up
Bitgret (BRISE) price rally has momentum but no confirmation. With the price sitting just below 0.17e⁻⁶ resistance, the next move will decide everything—breakout or rejection. Until that level is reclaimed with strength, this remains a high-risk, liquidity-driven setup rather than a confirmed trend reversal.