Bitcoin’s Big Money Is Moving — Old Whales Selling At A Furious Pace


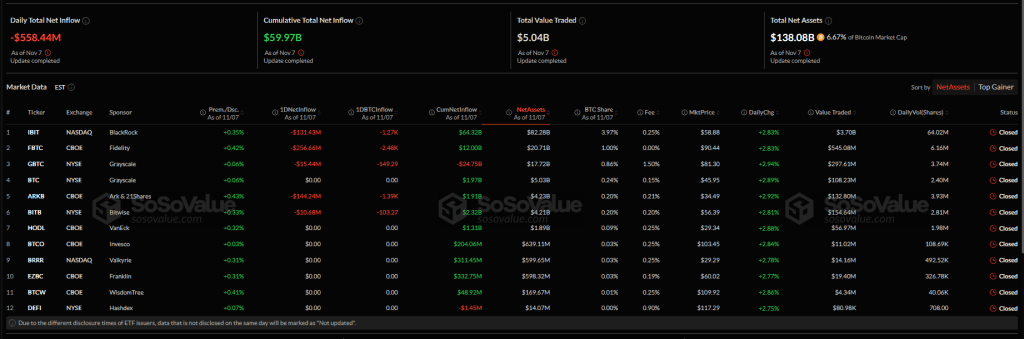
Bitcoin-focused ETFs recorded their largest single-day outflow since August, pulling a combined $558 million from the market as prices hovered near $102,000. Data from SoSoValue shows the move pushed some big funds into the red for the day and sent fresh signals that traders are rebalancing after recent gains.
Fidelity And Ark Lead Outflows
Fidelity’s FBTC saw the biggest withdrawal at $256 million. Ark Invest And 21Shares’ ARKB followed with $144 million in redemptions, a record relative to that fund’s size. BlackRock’s IBIT also recorded $131 million of outflows, marking the seventh day of net withdrawals in eight trading sessions.
At the same time, reports show JPMorgan boosted its stake in BlackRock’s ETF by 64%, bringing its holding to 5.28 million shares valued at $343 million as of September 30. The bank also held $68 million in call options and $133 million in put positions on the same date.
Market Participants Trim Positions While Some Add
Based on reports, the big daily outflow looks less like a crash and more like position shifting. Some managers appear to be taking profits. Others are quietly adding exposure, which helps explain why prices held roughly steady despite the redemptions. Traders watching ETF flows say the moves reflect growing macro uncertainty rather than a complete loss of faith in Bitcoin.

On-chain trackers show that long-dormant wallets are moving large amounts. Sales in the $100 million to $500 million range have been logged from addresses that had been still for years.
K33 Research flagged that 319,000 BTC that had been held for six to 12 months moved into profit-taking. The firm also reported that “mega whales” sold roughly $45 billion worth of Bitcoin in the past month. Analysts describe this as a major, organized exit by early holders.
 Price Holds Inside Key Range As Moving Averages Cap Gains
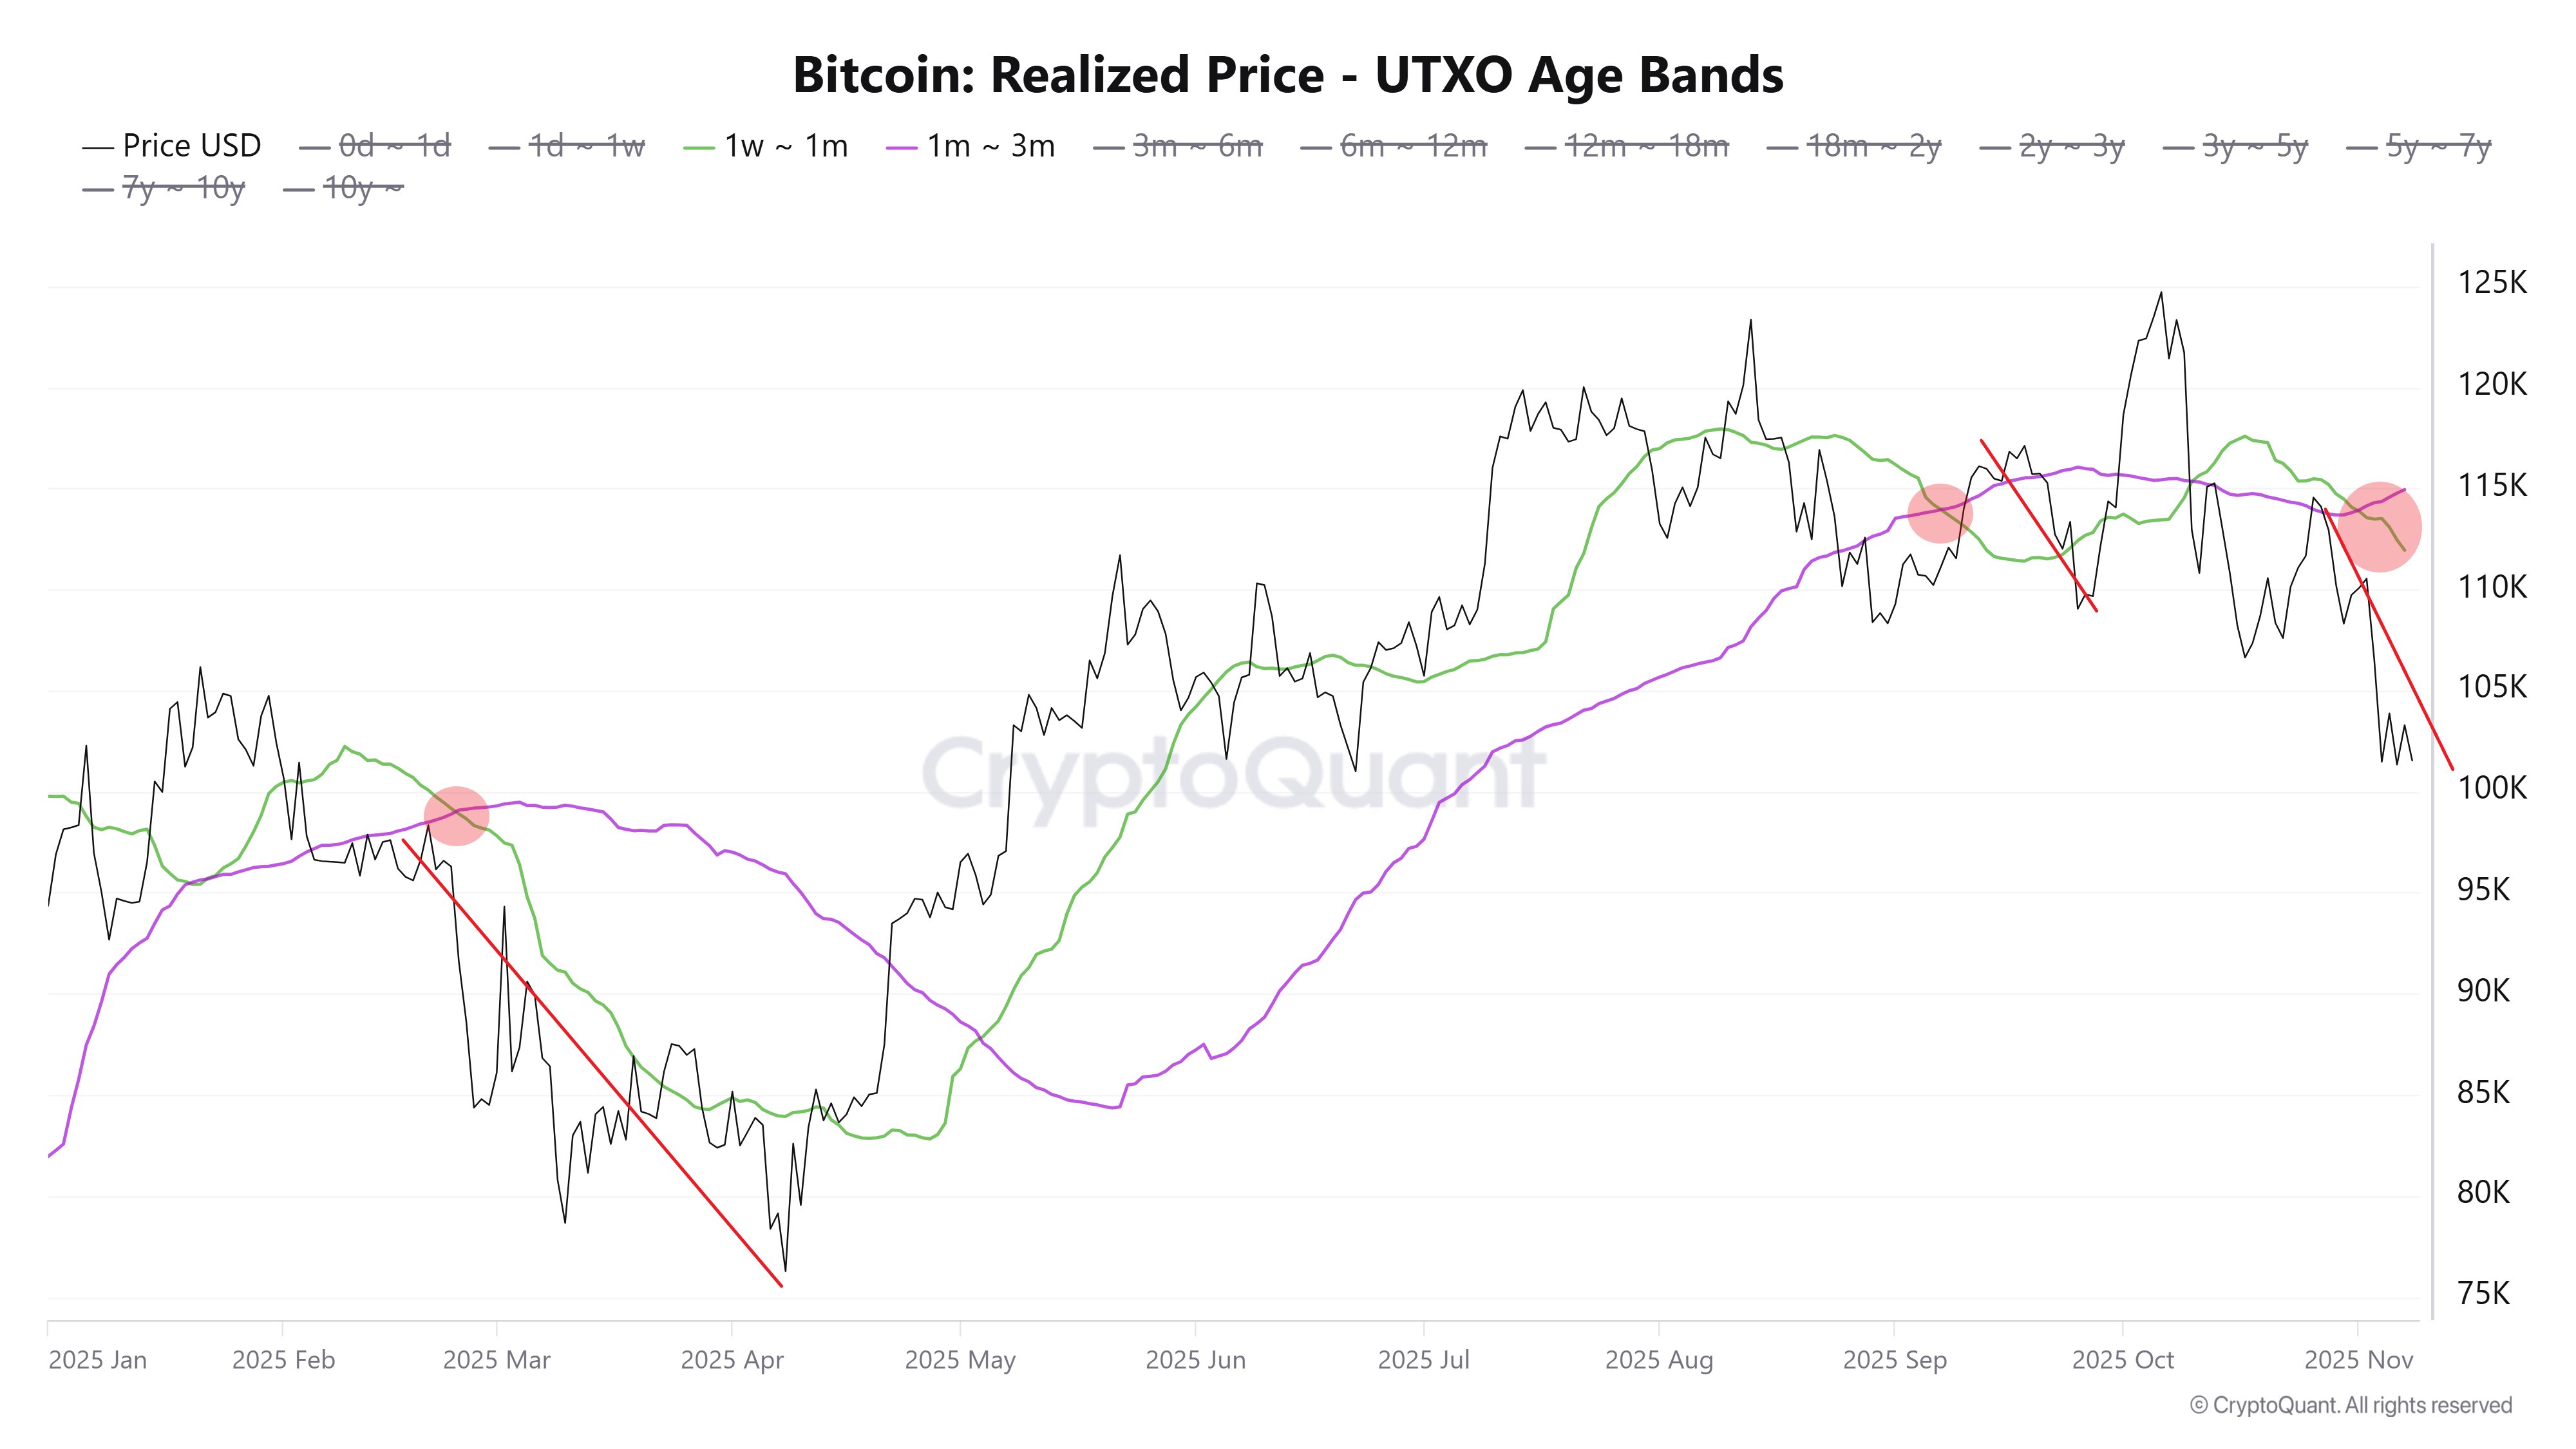
Bitcoin has been trading in a tight band. Reports place a demand block between $100K–$102K and a resistance cluster near $114K. The 100-day and 200-day moving averages are above current prices and acted as overhead resistance.
A recent rejection around the 100-day MA near $110K led to a quick retest of the roughly $101K support, which some traders interpret as a liquidity sweep.
Price Stabilization Could Signal AbsorptionWhat stands out for chart watchers is stabilization at a high-volume node where past corrections have found a base. There is an extended series of equal lows, marked on some charts as support levels, suggesting liquidity below $100K may have been cleared.
Featured image from Unsplash, chart from TradingView

XRP Ready For The 5th Wave: Analyst Says Don’t Fight It
XRP has spent the past week on the continuation of a downtrend from the previous week, slipping from...
Bitcoin UTXO Age Bands Put Local Bottom At $95K — Here’s Why
After a disappointing performance during the week, the price of Bitcoin has continued its sluggish a...
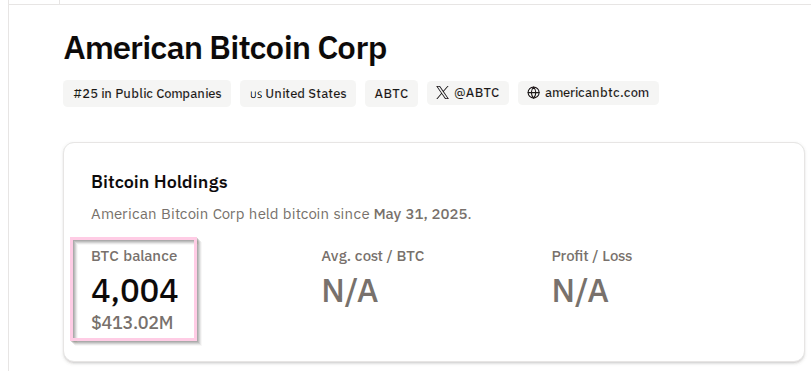
Trump’s Bitcoin Bet Grows: American Bitcoin Now Holds Over 4,000 BTC
American Bitcoin, the Nasdaq-listed mining and treasury firm backed by Eric Trump and Donald Trump J...