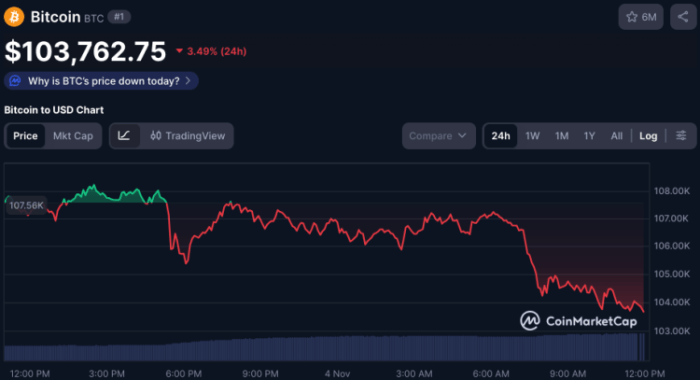
Bitcoin Sell-Off Continues — Downside Momentum Builds Across Crypto Market


Bitcoin price is gaining bearish pace below $108,800. BTC could continue to move down if it stays below the $109,500 resistance.
- Bitcoin started a fresh decline below the $109,000 support.
- The price is trading below $108,000 and the 100 hourly Simple moving average.
- There is a bearish trend line forming with resistance at $109,400 on the hourly chart of the BTC/USD pair (data feed from Kraken).
- The pair might continue to move down if it trades below the $105,000 zone.
Bitcoin Price Dips Further
Bitcoin price failed to stay above the $110,000 support level and started a fresh decline . BTC dipped below $109,000 and $108,800 to enter a bearish zone.
The decline was such that the price traded below the 76.4% Fib retracement level of the upward move from the $106,310 swing low to the $111,000 high. Besides, there is a bearish trend line forming with resistance at $109,400 on the hourly chart of the BTC/USD pair.
Bitcoin is now trading below $108,000 and the 100 hourly Simple moving average . BTC tested the 1.236 Fib extension level of the upward move from the $106,310 swing low to the $111,000 high.
If the bulls attempt a recovery wave, the price could face resistance near the $108,200 level. The first key resistance is near the $108,800 level. The next resistance could be $109,500 and the trend line. A close above the $109,500 resistance might send the price further higher. In the stated case, the price could rise and test the $110,000 resistance. Any more gains might send the price toward the $111,500 level. The next barrier for the bulls could be $112,000 and $112,500.
More Losses In BTC?
If Bitcoin fails to rise above the $108,800 resistance zone, it could continue to move down. Immediate support is near the $106,200 level. The first major support is near the $105,500 level.
The next support is now near the $105,000 zone. Any more losses might send the price toward the $104,200 support in the near term. The main support sits at $103,500, below which BTC might struggle to recover in the short term.
Technical indicators:
Hourly MACD – The MACD is now gaining pace in the bearish zone.
Hourly RSI (Relative Strength Index) – The RSI for BTC/USD is now below the 50 level.
Major Support Levels – $106,200, followed by $105,500.
Major Resistance Levels – $108,800 and $109,500.
Bitcoin Price Prediction as Technicals Remain Bullish: Why $HYPER Could Soar Next Year
What to Know: Bitcoin price holds above $100K, with models pointing to a $135K–$140K target for Dece...

Ripple Buys Palisade in $4B Investment Streak & Wallet Tokens like $BEST Could Explode
What to know Ripple acquired Palisade, a digital asset wallet firm, expanding its institutional cust...
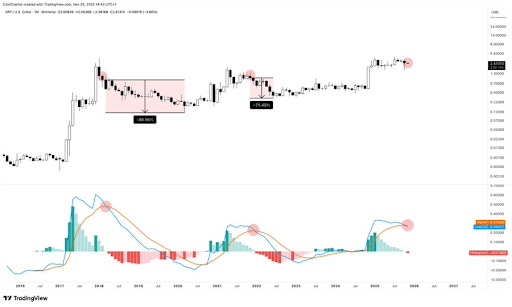
Rare Chart Formation That Led To An 87% XRP Price Crash Has Resurfaced
Crypto analyst Tony Severino has revealed a rare chart formation, which presents a bearish outlook f...