Bitcoin Trades Sideways — Consolidation Above Support Could Fuel Next Upside


Bitcoin price is consolidating gains above $113,500. BTC could rise further if there is a clear move above the $115,750 resistance.
- Bitcoin started a fresh upward move above the $114,000 resistance level.
- The price is trading above $114,200 and the 100 hourly Simple moving average.
- There is a bullish trend line forming with support at $113,900 on the hourly chart of the BTC/USD pair (data feed from Kraken).
- The pair might continue to move up if it trades above the $115,750 zone.
Bitcoin Price Starts Consolidation
Bitcoin price formed a base and started a fresh increase above the $112,500 zone. BTC gained pace for a move above the main hurdle at $113,500.
It opened the doors for a move above $115,000 and the 100 hourly Simple moving average. Finally, the price spiked above $116,000 and is currently consolidating gains above the 23.6% Fib retracement level of the recent wave from the $106,718 swing low to the $116,309 high.
Besides, there is a bullish trend line forming with support at $113,900 on the hourly chart of the BTC/USD pair. Bitcoin is now trading above $114,000 and the 100 hourly Simple moving average.
Immediate resistance on the upside is near the $115,000 level. The first key resistance is near the $115,500 level. The next resistance could be $115,750. A close above the $115,750 resistance might send the price further higher. In the stated case, the price could rise and test the $116,300 resistance. Any more gains might send the price toward the $117,500 level. The next barrier for the bulls could be $118,000.
Another Pullback In BTC?
If Bitcoin fails to rise above the $115,500 resistance zone, it could start a fresh decline. Immediate support is near the $114,000 level. The first major support is near the $113,500 level or the trend line.
The next support is now near the $111,000 zone. Any more losses might send the price toward the $110,500 support in the near term. The main support sits at $108,500, below which BTC might struggle to recover in the short term.
Technical indicators:
Hourly MACD – The MACD is now gaining pace in the bullish zone.
Hourly RSI (Relative Strength Index) – The RSI for BTC/USD is now above the 50 level.
Major Support Levels – $114,000, followed by $113,500.
Major Resistance Levels – $115,500 and $116,500.
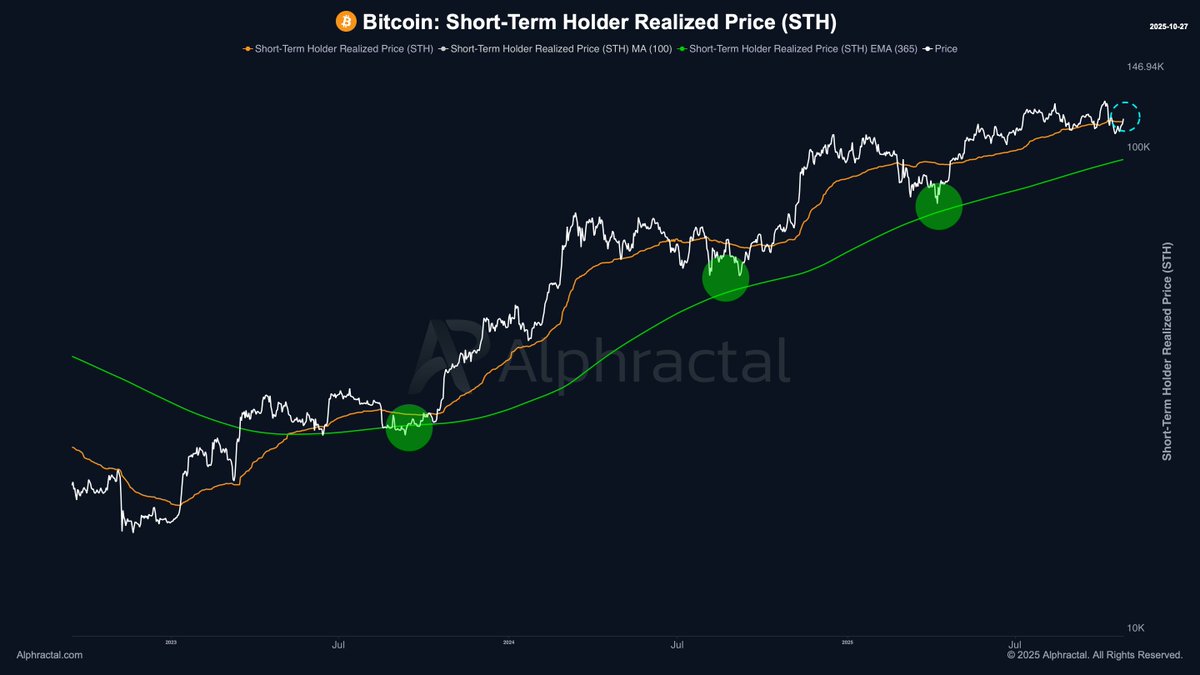
Bitcoin Breaks Above STH Realized Price For The First Time In Weeks – What’s Next?
Bitcoin is showing early signs of strength as it attempts to reclaim the $115,000 level. After weeks...

Dogecoin Open Interest Crashes 50% From October Highs, Volume Is Worse, What’s Going On?
Dogecoin (DOGE) is facing a steep market cooldown after weeks of heightened trading activity in earl...
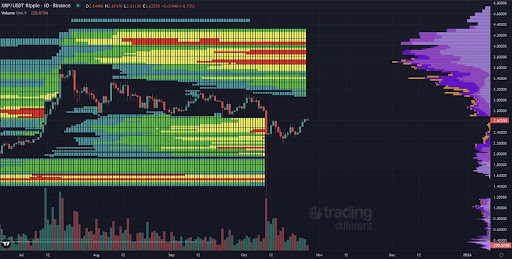
Here’s Why The XRP Price Still Isn’t Bearish Despite The 50% Flash Crash
The XRP price recently saw a sharp drop that was very scary for many traders, and some in the crypto...