Solana (SOL) Holds Ground in Tight Range — Traders Watch for Directional Cue


Solana started a fresh increase from the $160 zone. SOL price is now consolidating gains and might aim for more gains above the $172 zone.
- SOL price started a fresh increase above the $165 level against the US Dollar.
- The price is now trading above $168 and the 100-hourly simple moving average.
- There was a break above a connecting bearish trend line with resistance at $167 on the hourly chart of the SOL/USD pair (data source from Kraken).
- The pair could start a fresh increase if it clears the $172 resistance zone.
Solana Price Recovers Above $165
Solana price formed a base above the $160 support and started a fresh increase, like Bitcoin and Ethereum . SOL gained pace for a move above the $162 and $165 resistance levels.
There was a clear move above the 50% Fib retracement level of the downward move from the $177 swing high to the $160 low. Besides, there was a break above a connecting bearish trend line with resistance at $167 on the hourly chart of the SOL/USD pair.
However, the bears were active near the $172 resistance zone. The 76.4% Fib retracement level of the downward move from the $177 swing high to the $160 low is acting as a resistance.
Solana is now trading above $168 and the 100-hourly simple moving average. On the upside, the price is facing resistance near the $172 level. The next major resistance is near the $176 level. The main resistance could be $180. A successful close above the $180 resistance zone could set the pace for another steady increase. The next key resistance is $192. Any more gains might send the price toward the $200 level.
Another Decline in SOL?
If SOL fails to rise above the $172 resistance, it could start another decline. Initial support on the downside is near the $168 zone. The first major support is near the $165 level.
A break below the $165 level might send the price toward the $162 zone. If there is a close below the $162 support, the price could decline toward the $150 support in the near term.
Technical Indicators
Hourly MACD – The MACD for SOL/USD is losing pace in the bullish zone.
Hourly Hours RSI (Relative Strength Index) – The RSI for SOL/USD is above the 50 level.
Major Support Levels – $165 and $162.
Major Resistance Levels – $172 and $176.

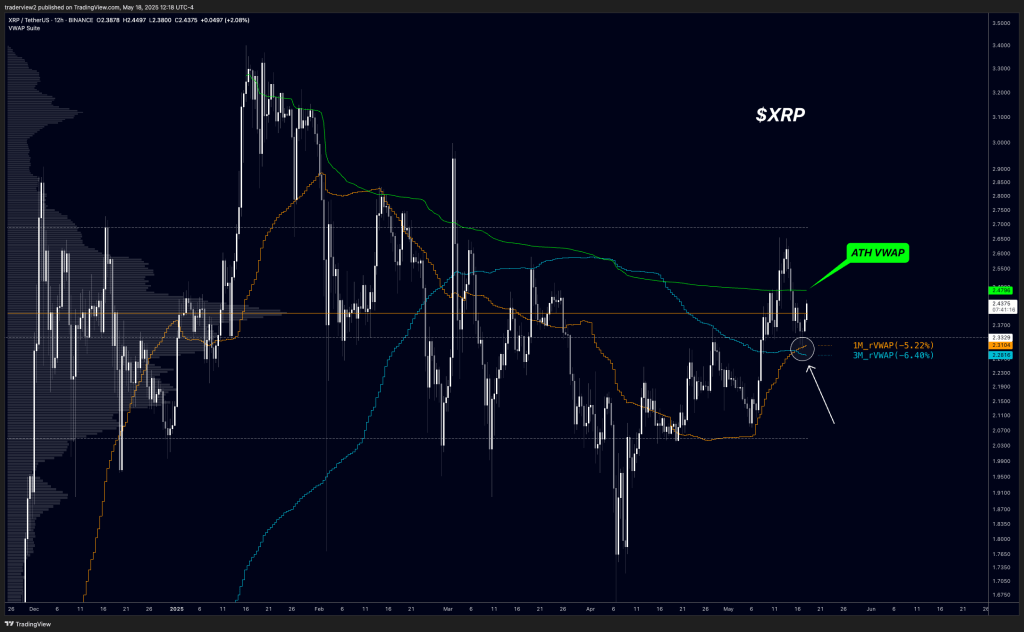
Massive XRP Selling Pressure Is Stalling Price Action, Analyst Warns
XRP’s latest rally attempt has stalled just beneath a key volume-weighted average price (VWAP) level...

Can Dogecoin Price Reach $0.7 Again? What The Volume Trend Says
The Dogecoin price has failed to reach its all-time high peaks after repeated rallies and subsequent...

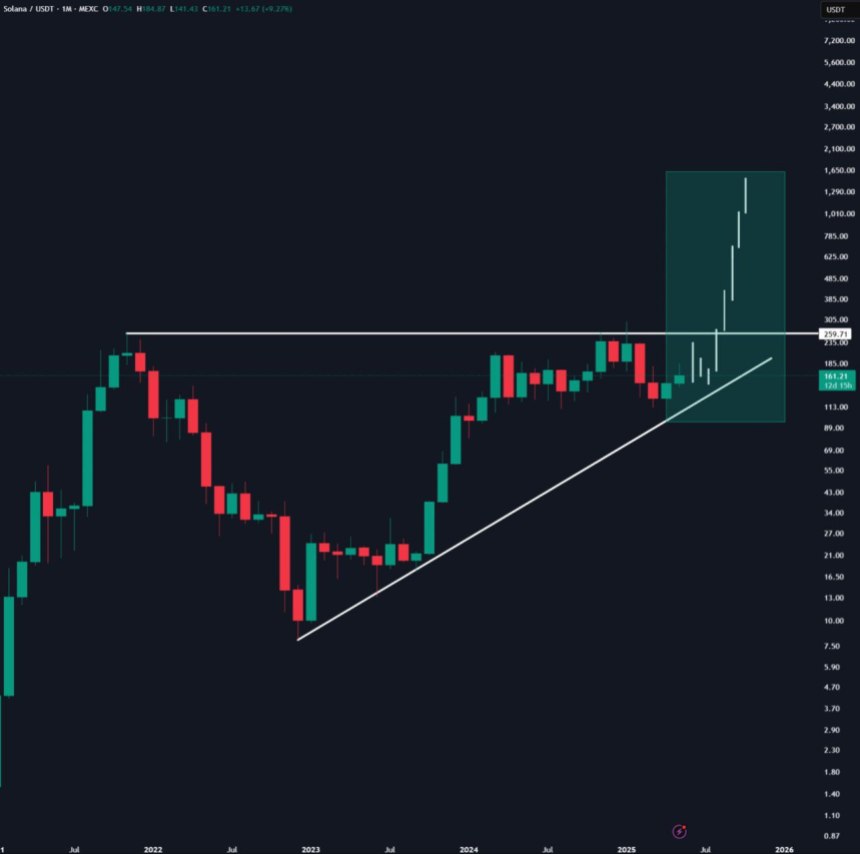
Solana Rejected From Key ‘Inflection Point’, But Multi-Year Trend Suggests New Highs
Solana (SOL) has reclaimed crucial levels amid its price rally, recording its highest range in month...

