Ethereum Declines to $2,575 as Liquidations Rise and Bullish Momentum Fades


- Ethereum dropped 4% to $2,575, with long liquidations taking $64.6 million in 24 hours.
- The open interest dropped 4.5% to $31.52 billion, reflecting a lack of confidence by the traders.
- The ETH/BTC chart made a bottom around 0.045, copying the 2019 formation prior to the 2021 breakout.
Ether dropped 4% in the previous 24 hours, dropping to around $2,575 on 15 May. This decline followed a larger decline in the crypto market . With a 2.4% decline recorded in the total market capitalization, nearly $3.3 trillion.
The ETH/BTC chart showed how Ethereum created a bottom around the 0.045 support. This format was a near replica of its 2019-cycle low that was followed by a breakout in 2021. That first move was preceded by a consolidation period of 118 weeks before the upward phase started.
In addition, the decline in the price of Ethereum has also gone along the same pattern as other leading digital assets, which would hint at an overall decline in sentiment. This adjustment reversed recent improvements registered at the beginning of the month.
Traders exit positions as liquidations increase.
The fall in Ether’s price has led to massive liquidation of long positions. According to CoinGlass data, long positions were worth $64.6 million in 24 hours. However, short liquidations recorded only $21 million within the same period. The difference indicated a significant drop in bullish business deals as prices reversed.

Furthermore, Open interest was down by 4.5 percent to stand at $31.52 billion, indicating a drop in trader confidence, with the derivatives sphere witnessing less activity. The 24-hour long/short ratio hit 0.9558, pointing to a slight seller’s advantage in the whole positioning.

On the other hand, trading volumes decreased drastically by 32.5%. When looked at together, these figures indicate declining participation in market activity and waning bullishness in the markets for Ethereum.
Meanwhile, analysts watched how forced sell-offs have exacerbated the downside move. The decline in open interest and reduced inflows further ascertained the investors’ reluctance. Such behavior was consistent with the previous market corrections whereby price pressure came in after a massive liquidation and loss of interest.
Technical Indicators Show Slowing Momentum
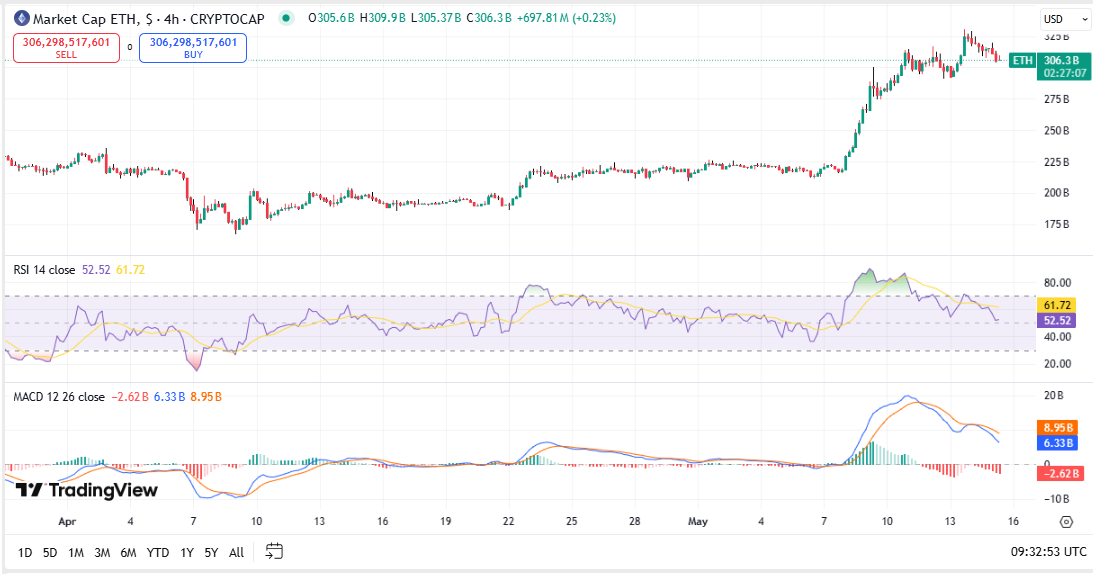
Ethereum’s market cap continued trading above $308 billion at press time, recording a meager 0.93% increase from its last session. The asset previously broke out over the $275 billion mark but has since gone into a short-term consolidating mode.
The relative Strength Index on the four-hour chart dropped out of overbought territory at 70, down to 53.68, cutting down on buying power. At the same time, the MACD indicator displayed the crossover of the signal line over the MACD line, which means there is a loss of bullish momentum.

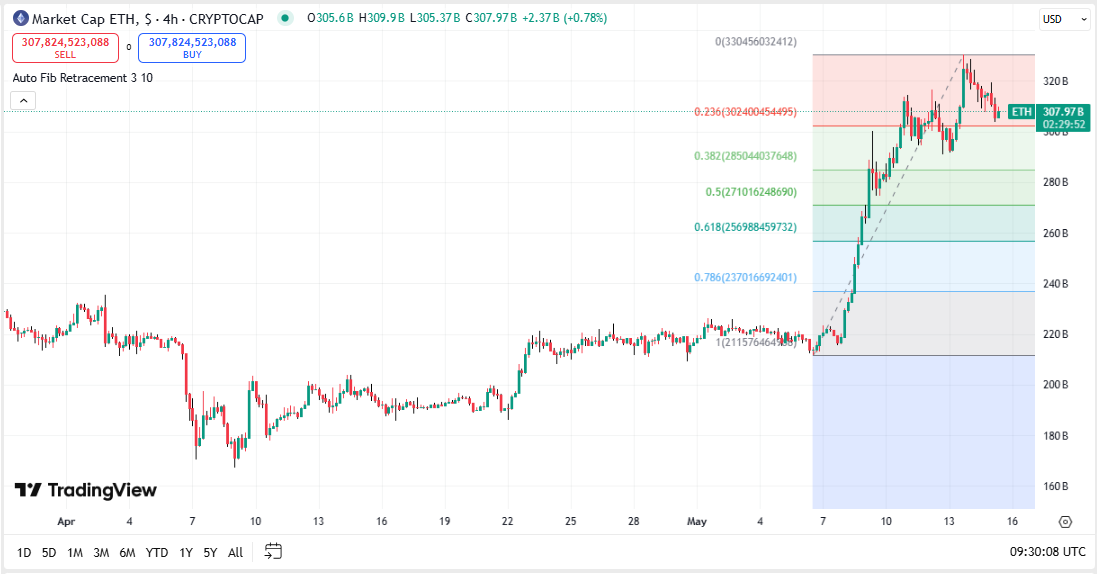
The Fibonacci retracement tool identified essential support at the 0.236 level of $302.4 billion. Ethereum moved above that level and stalled at $308.46 billion. The following are the supports, which are measured at $285B, $271B, and $256B.

Furthermore, the recent rally has actioned off a low at $211.6 billion, with crucial Fibonacci retracement levels recognized at 38.2%, 50%, and 61.8%, consistent with the observed support zones held back in history. Activity around the $302.4 billion price suggested a temporary hold in the current correction process.

Trump-Linked Wallet Executes $6M Token Swap Amid Vaulta Rebranding and Cross-Chain Transfers
Trump-linked wallet spent $6M USDT on Vaulta (A) and EOS across BSC and exSat; Ethereum data shows t...

Ethereum Tops the Charts in Weekly NFT Sales With $44.7 Million in Sales Volume
The NFT market saw Ethereum maintain its leading position, with over $44.7 million in sales volume i...

SentismAI Integrates KyberSwap for Seamless EVM Chain Swaps
The collaboration not just enhances utility but also shows SentismAI’s endeavor of delivering democr...

