Bitcoin Price Analysis: BTC Slips Below $110,000— Are Bears Back in Control?


The post Bitcoin Price Analysis: BTC Slips Below $110,000— Are Bears Back in Control? appeared first on Coinpedia Fintech News
Bitcoin’s recent price action has turned sharply bearish after the price fell below the $110,000 mark, a level that previously served as a strong base for buyers. This breakdown suggests that bullish momentum is losing steam, with traders starting to secure profits after weeks of steady gains.
The current correction follows several failed attempts to sustain above $116,000 resistance. As of writing, BTC is trading slightly below $109,000, marking a notable shift in short-term sentiment. This move places Bitcoin at risk of testing lower support zones, as the broader market cools off after an extended rally.
Technical Breakdown: What the Charts Reveal
The 4-hour and daily charts indicate a clear rejection from the $116,000 resistance zone, followed by a consistent drop in trading volume—often a precursor to a trend reversal.
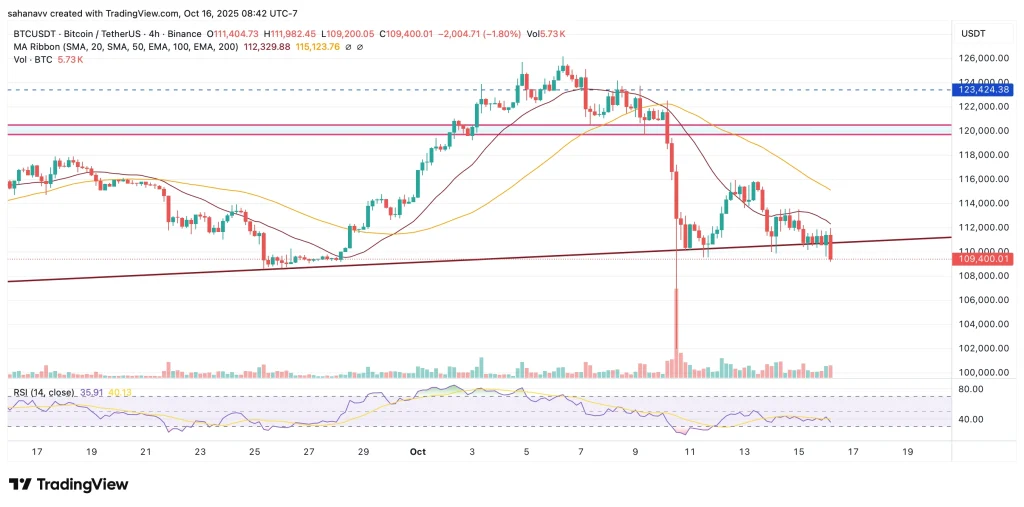
- Moving Averages: The 20-day moving average has flattened near $111,000, while the 50-day MA is rising toward $107,500. A cross below this level could confirm short-term weakness.
- RSI: The Relative Strength Index has slipped below 50, indicating that momentum now favors sellers.
- CMF (Chaikin Money Flow): The CMF has turned negative, hinting at outflows from major wallets and short-term de-risking.
The chart now forms a descending channel, suggesting potential downside continuation unless BTC quickly recovers the lost zone.
Key Levels to Watch
| Zone | Importance |
| $110,000–$111,000 | Broken support; now an immediate resistance zone |
| $108,000 – $104,000 | Near-term demand zone where buyers could reappear |
| $100,000 – $95,000 | Major structural support and potential correction target |
| $116,000 | Upper resistance to invalidate the bearish setup |
If Bitcoin fails to reclaim $110,000 on a daily close, the probability of retesting $104,000–$100,000 increases significantly.
On-Chain and Market Sentiment Insights
On-chain data reflects a slight cooling in accumulation activity. Whale wallet inflows to exchanges have risen modestly over the past 24 hours, hinting at short-term distribution. Meanwhile, derivative funding rates are neutral, implying that traders are not overly leveraged to either side.
The overall sentiment remains cautiously bearish, with traders eyeing the next major liquidity zone near $100,000—a level that aligns with Bitcoin’s long-term ascending trendline from mid-2024.
Scenario Outlook and Price Targets
Bearish Scenario : If selling pressure continues below $108,000, Bitcoin could extend its decline toward $104,000 in the short term. A break under that level exposes $100,000–$95,000 as the next major downside targets.
Bullish Reversal Scenario : A strong bounce reclaiming $110,000, followed by a close above $112,500, could neutralise the bearish structure. In that case, BTC might attempt another push toward $116,000–$120,000.
Neutral/Range-Bound Setup : BTC could consolidate between $104,000 and $111,000 before choosing its next direction, especially if macro data or ETF flows remain quiet.
Final Thoughts
Bitcoin’s break below $110,000 marks a pivotal shift in short-term structure, handing temporary control to the bears. Technicals hint at a cooling phase that could see BTC revisit deeper supports around $104,000–$100,000 before buyers reemerge.
However, the broader uptrend remains intact as long as Bitcoin holds above its $95,000 macro support. A quick reclaim of $110,000 would invalidate this breakdown and potentially reignite the rally toward $125,000.

Crypto Market Correction Deepens: On-Chain Data Points to Capitulation—What’s Next?
The post Crypto Market Correction Deepens: On-Chain Data Points to Capitulation—What’s Next? appeare...

Why Ozak AI’s Rapid $3.65M Growth at $0.012 Is Creating FOMO Among Investors Who Missed Early Bitcoin
The post Why Ozak AI’s Rapid $3.65M Growth at $0.012 Is Creating FOMO Among Investors Who Missed Ear...

XRP May Hit $5, But Ozak AI Price Prediction Suggests Bigger Upside
The post XRP May Hit $5, But Ozak AI Price Prediction Suggests Bigger Upside appeared first on Coinp...