XRP Price Reclaims $3 – Bulls Struggle to Build on Gains


XRP price started a downside correction below the $3.050 resistance. The price is now recovering losses and faces hurdles near the $3.080 zone.
- XRP price is consolidating losses after declining below the $3.120 resistance.
- The price is now trading below $3.080 and the 100-hourly Simple Moving Average.
- There was a break above a bearish trend line with resistance at $3.00 on the hourly chart of the XRP/USD pair (data source from Kraken).
- The pair could start a fresh increase if the price clears the $3.080 zone.
XRP Price Attempts Recovery
XRP price started a fresh decline below the $3.120 level, like Bitcoin and Ethereum . The price dipped below the $3.020 level to enter a short-term bearish zone.
There was a move below the $3.00 pivot level and the 100-hourly Simple Moving Average. A low was formed at $2.957 and the price recently started a recovery wave. There was a move above the 23.6% Fib retracement level of the downward move from the $3.186 swing high to the $2.957 low.
Besides, there was a break above a bearish trend line with resistance at $3.00 on the hourly chart of the XRP/USD pair. The price is now trading below $3.060 and the 100-hourly Simple Moving Average.
If the bulls protect the $3.00 support, the price could attempt another increase. On the upside, the price might face resistance near the $3.060 level. The first major resistance is near the $3.080 level or the 50% Fib retracement level of the downward move from the $3.186 swing high to the $2.957 low.
A clear move above the $3.080 resistance might send the price toward the $3.120 resistance. Any more gains might send the price toward the $3.180 resistance. The next major hurdle for the bulls might be near $3.250.
Another Decline?
If XRP fails to clear the $3.060 resistance zone, it could continue to move down. Initial support on the downside is near the $3.00 level. The next major support is near the $2.950 level.
If there is a downside break and a close below the $2.950 level, the price might continue to decline toward $2.880. The next major support sits near the $2.840 zone, below which the price could gain bearish momentum.
Technical Indicators
Hourly MACD – The MACD for XRP/USD is now losing pace in the bullish zone.
Hourly RSI (Relative Strength Index) – The RSI for XRP/USD is now above the 50 level.
Major Support Levels – $3.00 and $2.950.
Major Resistance Levels – $3.080 and $3.120.

Citi’s Ethereum Forecast: No New All-Time High Expected, Year-End Target At $4,300
Following an all-time high (ATH) reached last August, Ethereum (ETH), the market’s second-largest cr...
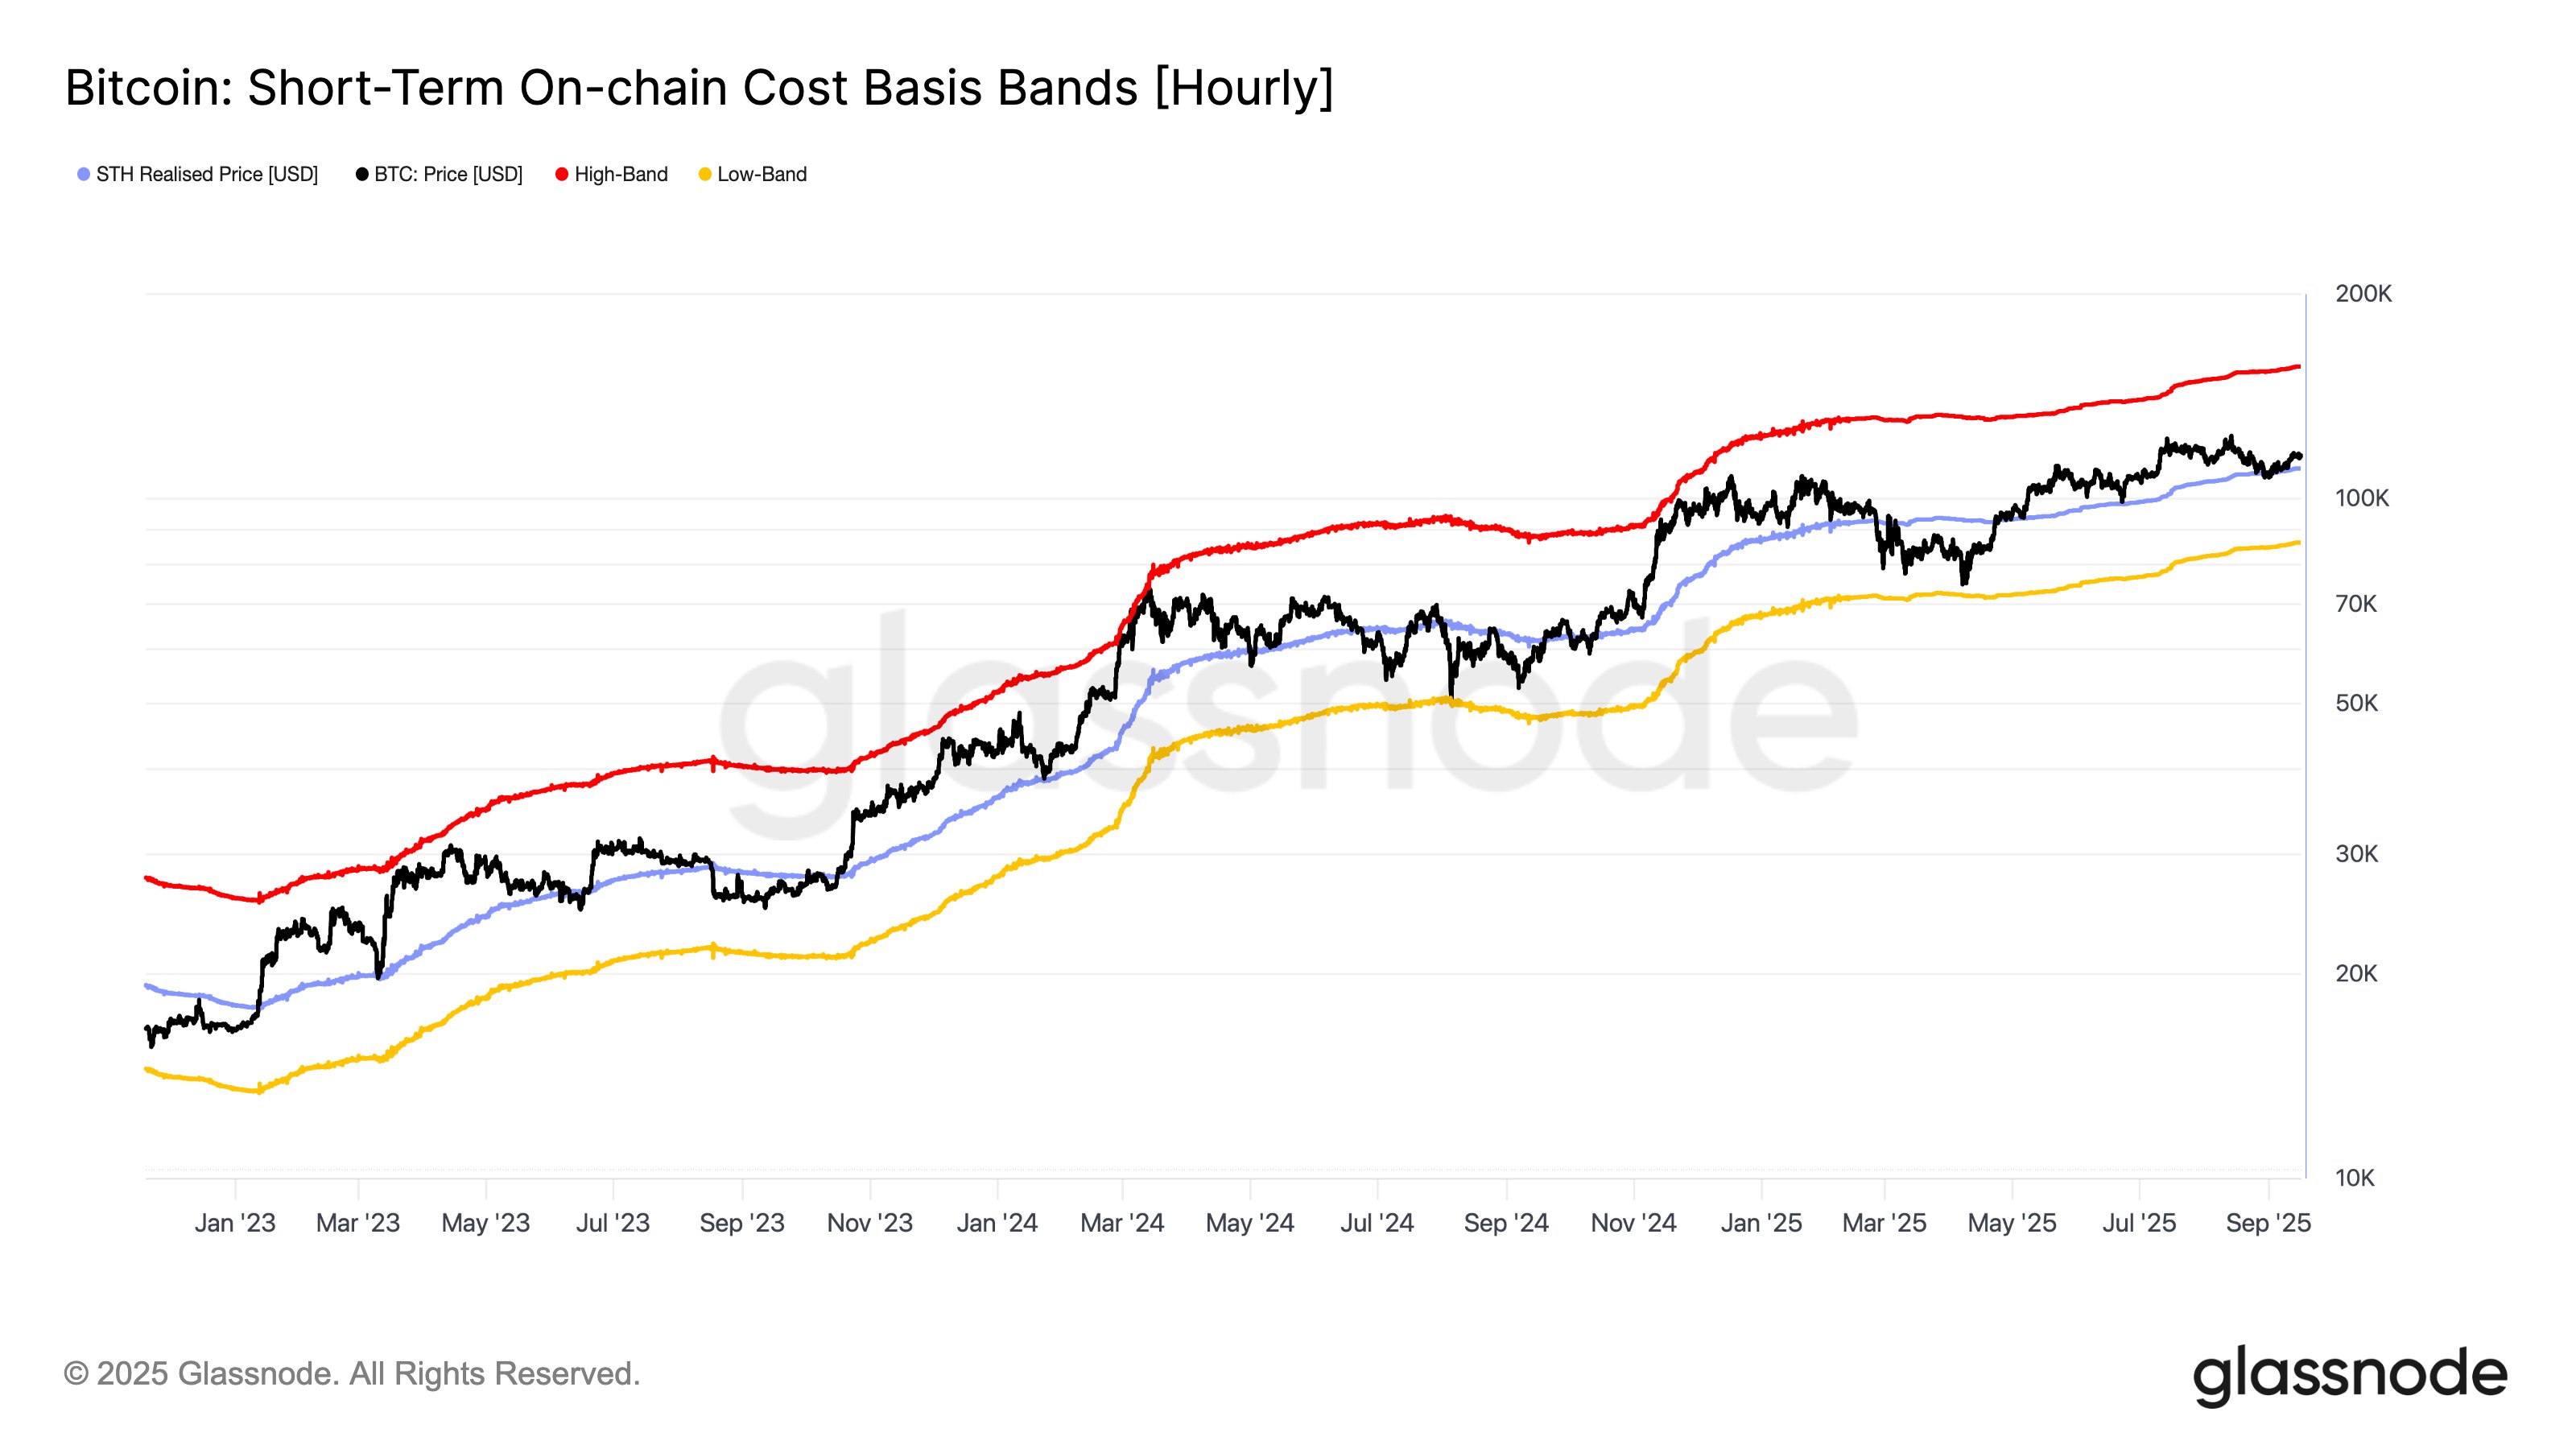
Bitcoin Trend Constructive As Long As This Metric Holds, Glassnode Says
On-chain analytics firm Glassnode has explained how the Bitcoin price trend remains constructive as ...
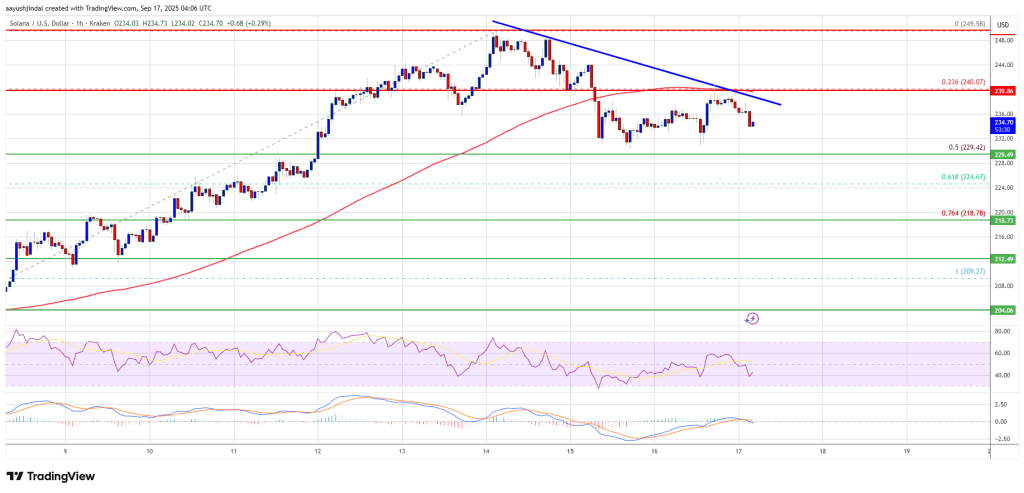
Solana (SOL) Holds Recent Gains – Key Levels Before Another Surge
Solana started a fresh increase above the $240 zone. SOL price is now consolidating gains below $240...