Ethereum Price Need Breakout – Key Hurdles Before Rally Can Continue


Ethereum price started a fresh decline below $4,620. ETH is now trading below $4,620 and might extend losses if it stays below $4,585.
- Ethereum is now correcting gains below the $4,620 zone.
- The price is trading below $4,600 and the 100-hourly Simple Moving Average.
- There is a bearish trend line forming with resistance at $4,580 on the hourly chart of ETH/USD (data feed via Kraken).
- The pair could start a fresh increase if it settles above $4,580 and $4,620.
Ethereum Price Faces Hurdles
Ethereum price started a fresh decline after it failed to stay above the $4,650 zone, like Bitcoin . ETH price corrected gains and dipped below the $4,600 support.
There was a move below the 50% Fib retracement level of the upward move from the $4,268 swing low to the $4,765 high. The bears were able to push the price below $4,500 and the 100-hourly Simple Moving Average. Besides, there is a bearish trend line forming with resistance at $4,580 on the hourly chart of ETH/USD.
Ethereum price is now trading below $4,560 and the 100-hourly Simple Moving Average. On the upside, the price could face resistance near the $4,550 level. The next key resistance is near the $4,580 level and the trend line.
The first major resistance is near the $4,620 level. A clear move above the $4,620 resistance might send the price toward the $4,665 resistance. An upside break above the $4,665 resistance might call for more gains in the coming sessions. In the stated case, Ether could rise toward the $4,720 resistance zone or even $4,740 in the near term.
Another Decline In ETH?
If Ethereum fails to clear the $4,580 resistance, it could start a fresh decline. Initial support on the downside is near the $4,480 level. The first major support sits near the $4,450 zone and the 61.8% Fib retracement level of the upward move from the $4,268 swing low to the $4,765 high.
A clear move below the $4,450 support might push the price toward the $4,380 support. Any more losses might send the price toward the $4,320 region in the near term. The next key support sits at $4,250.
Technical Indicators
Hourly MACD – The MACD for ETH/USD is losing momentum in the bullish zone.
Hourly RSI – The RSI for ETH/USD is now below the 50 zone.
Major Support Level – $4,450
Major Resistance Level – $4,580
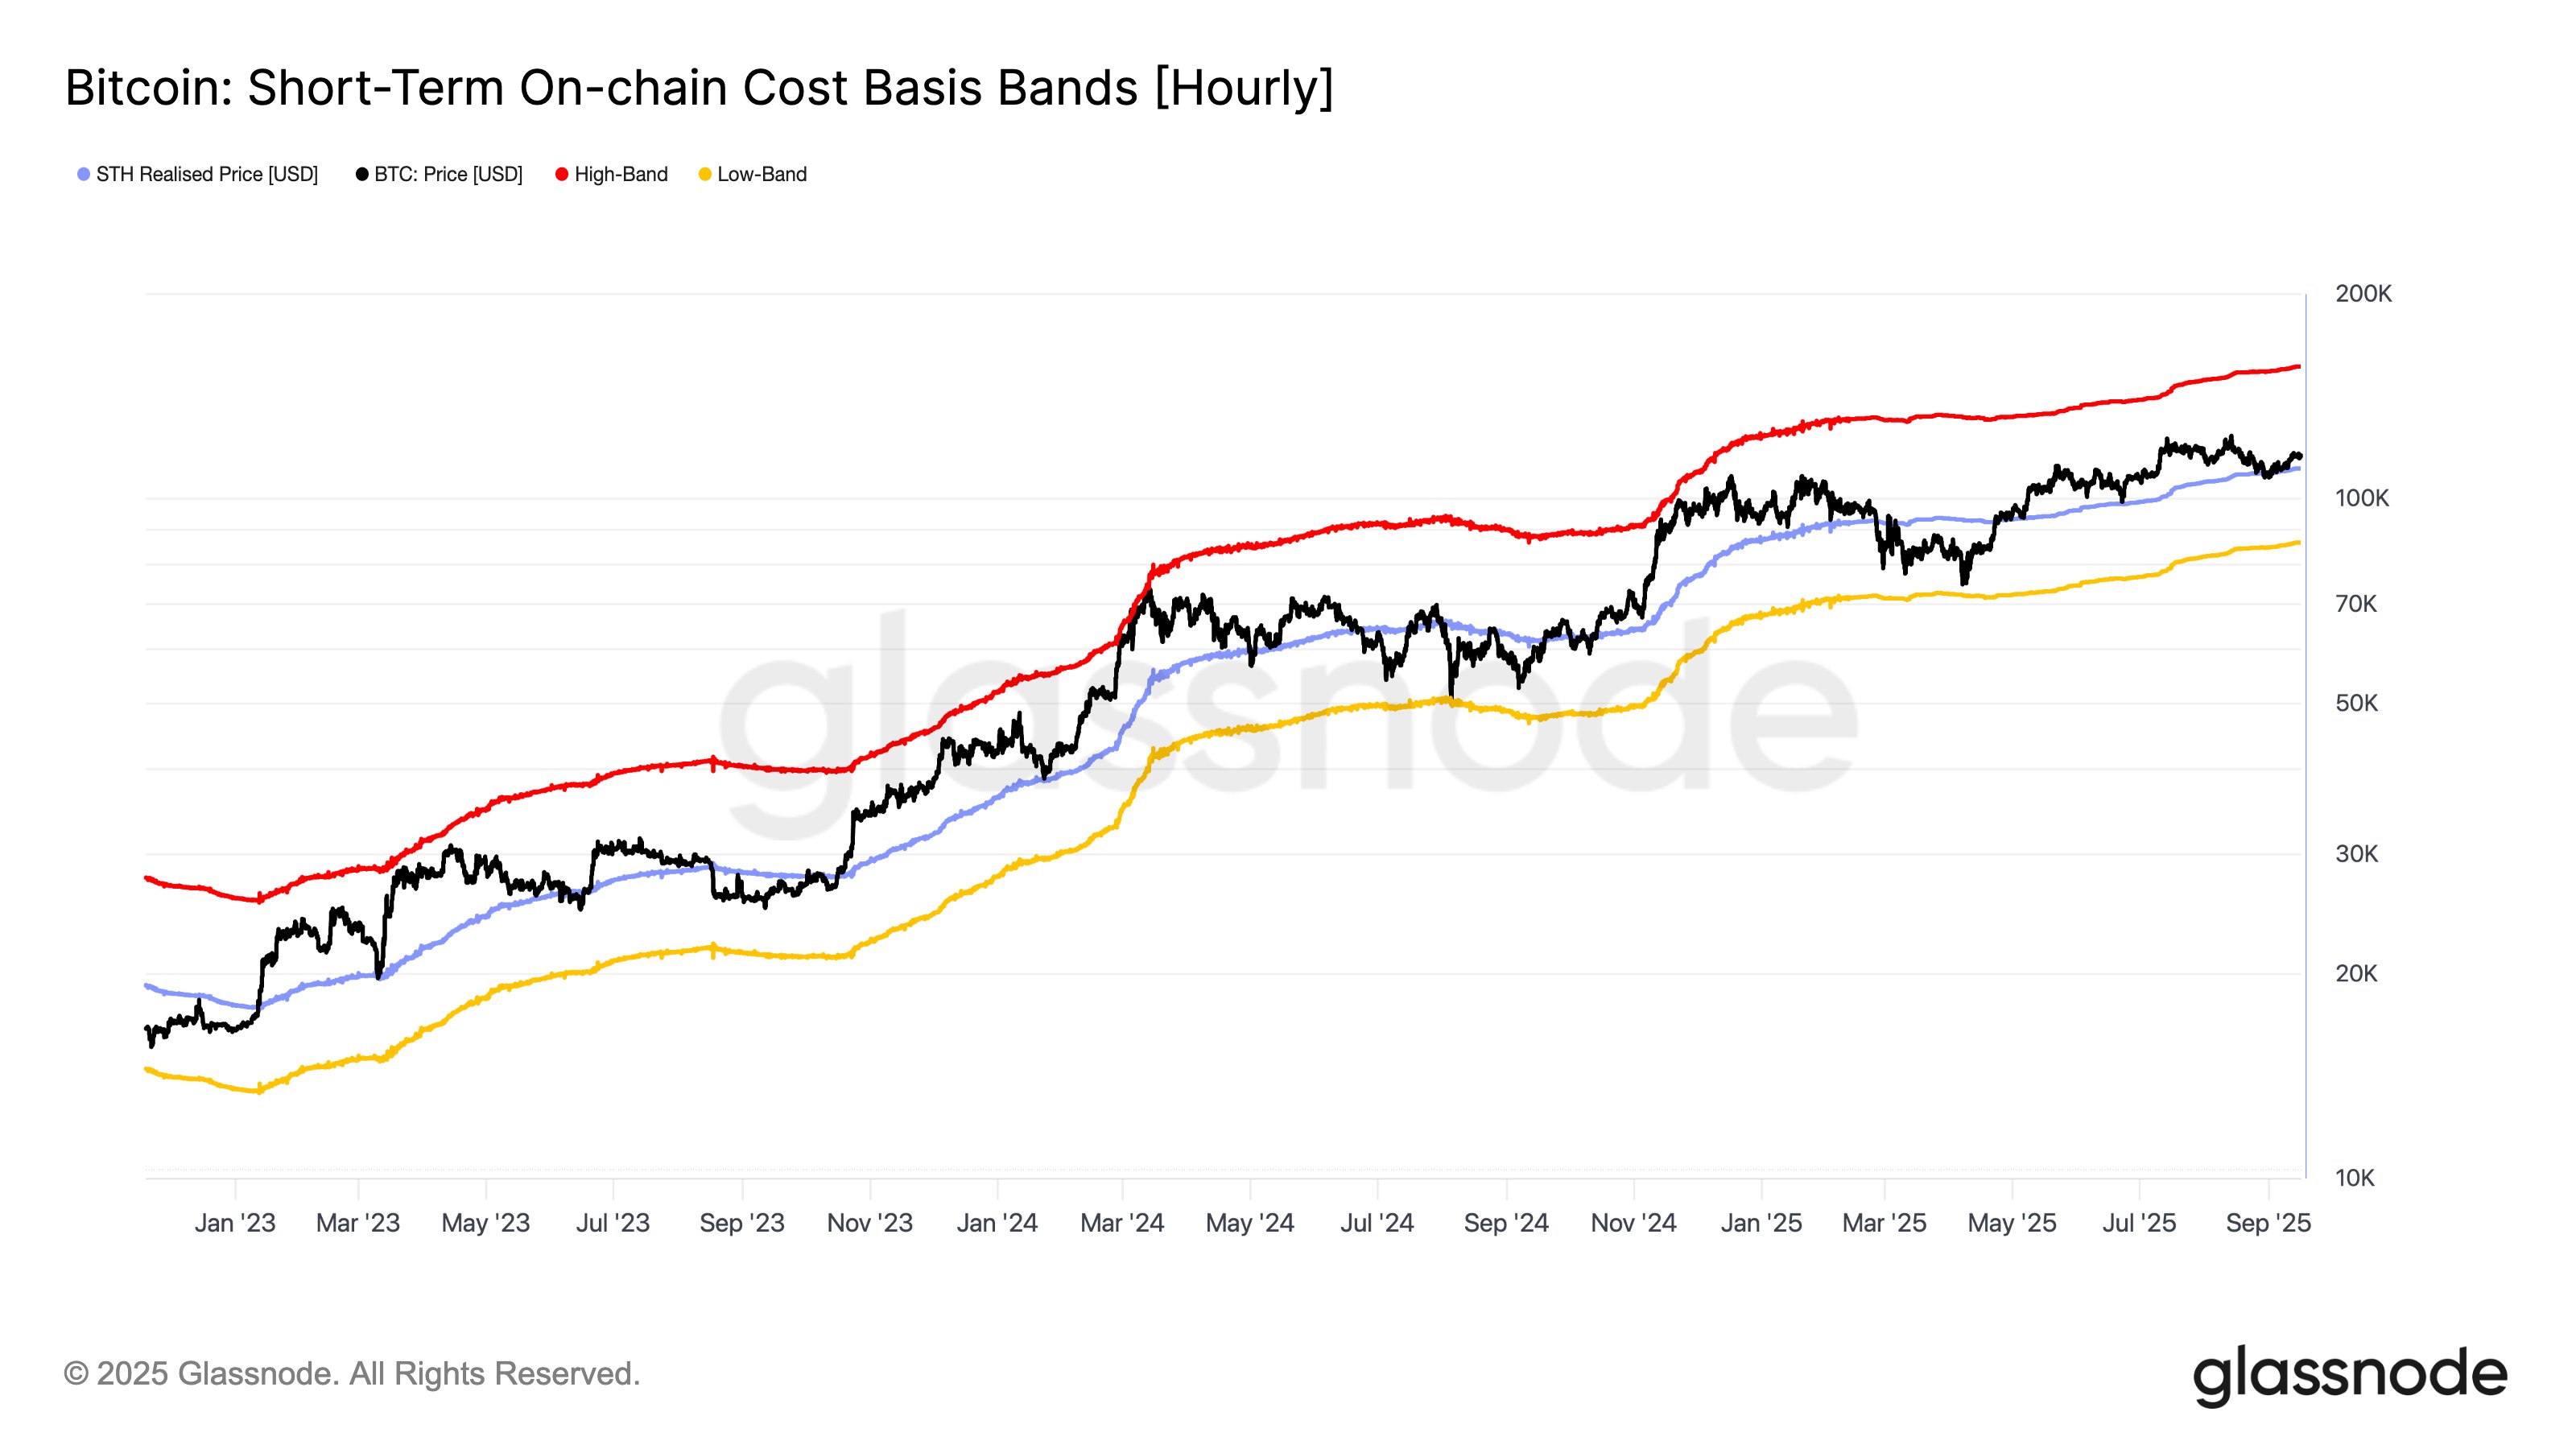
Bitcoin Trend Constructive As Long As This Metric Holds, Glassnode Says
On-chain analytics firm Glassnode has explained how the Bitcoin price trend remains constructive as ...
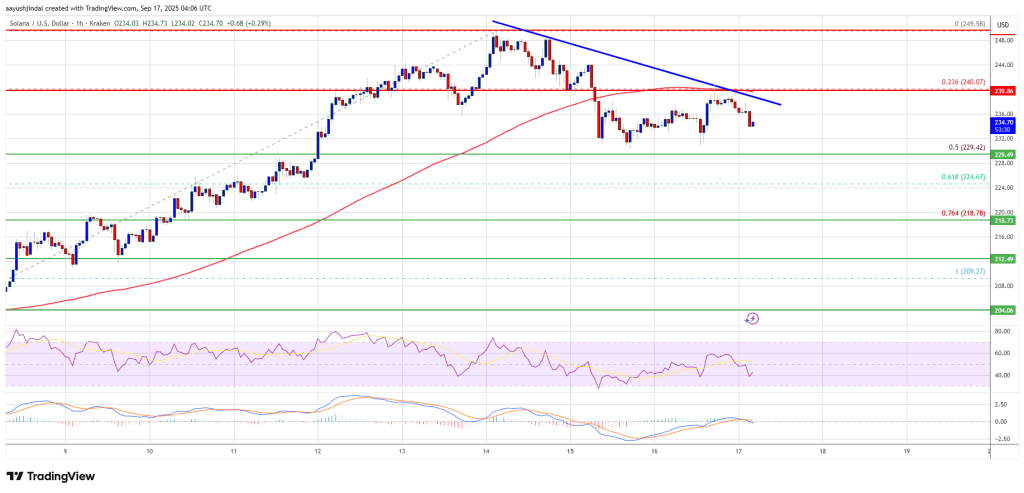
Solana (SOL) Holds Recent Gains – Key Levels Before Another Surge
Solana started a fresh increase above the $240 zone. SOL price is now consolidating gains below $240...

‘It’s Hyperliquid Moment,’ Circle States, Seizing HYPE’s 1,500% Surge With New Investment
Circle Internet Financial (CRCL), the firm behind the USDC stablecoin, has announced a significant i...