XRP Price Recovers Slightly, Can Buyers Push Past Obstacles?


XRP price is correcting losses from the $2.820 zone. The price is now trading below $3.050 and remains at risk of more losses in the near term.
- XRP price is showing bearish signs below the $3.10 resistance.
- The price is now trading near $3.00 and the 100-hourly Simple Moving Average.
- There is a bullish trend line forming with support at $2.970 on the hourly chart of the XRP/USD pair (data source from Kraken).
- The pair could continue to decline if it stays below the $3.050 zone.
XRP Price Faces Resistance
XRP price started a downside correction below $3.050, like Bitcoin and Ethereum . The price traded below the $3.00 and $2.95 levels before the bulls appeared.
A low was formed at $2.824 and the price is now attempting a fresh increase. There was a move above the $2.92 and $2.95 levels. The price surpassed the 50% Fib retracement level of the downward move from the $3.126 swing high to the $2.824 low.
The price is now trading near $3.00 and the 100-hourly Simple Moving Average. There is also a bullish trend line forming with support at $2.970 on the hourly chart of the XRP/USD pair.
On the upside, the price might face resistance near the $3.050 level and the 76.4% Fib retracement level of the downward move from the $3.126 swing high to the $2.824 low. The first major resistance is near the $3.10 level. A clear move above the $3.10 resistance might send the price toward the $3.120 resistance. Any more gains might send the price toward the $3.150 resistance. The next major hurdle for the bulls might be near $3.20.
Another Decline?
If XRP fails to clear the $3.050 resistance zone, it could start a fresh decline. Initial support on the downside is near the $2.970 level. The next major support is near the $2.920 level.
If there is a downside break and a close below the $2.920 level, the price might continue to decline toward $2.840. The next major support sits near the $2.780 zone, below which the price could gain bearish momentum.
Technical Indicators
Hourly MACD – The MACD for XRP/USD is now losing pace in the bearish zone.
Hourly RSI (Relative Strength Index) – The RSI for XRP/USD is now above the 50 level.
Major Support Levels – $2.970 and $2.840.
Major Resistance Levels – $3.050 and $3.10.
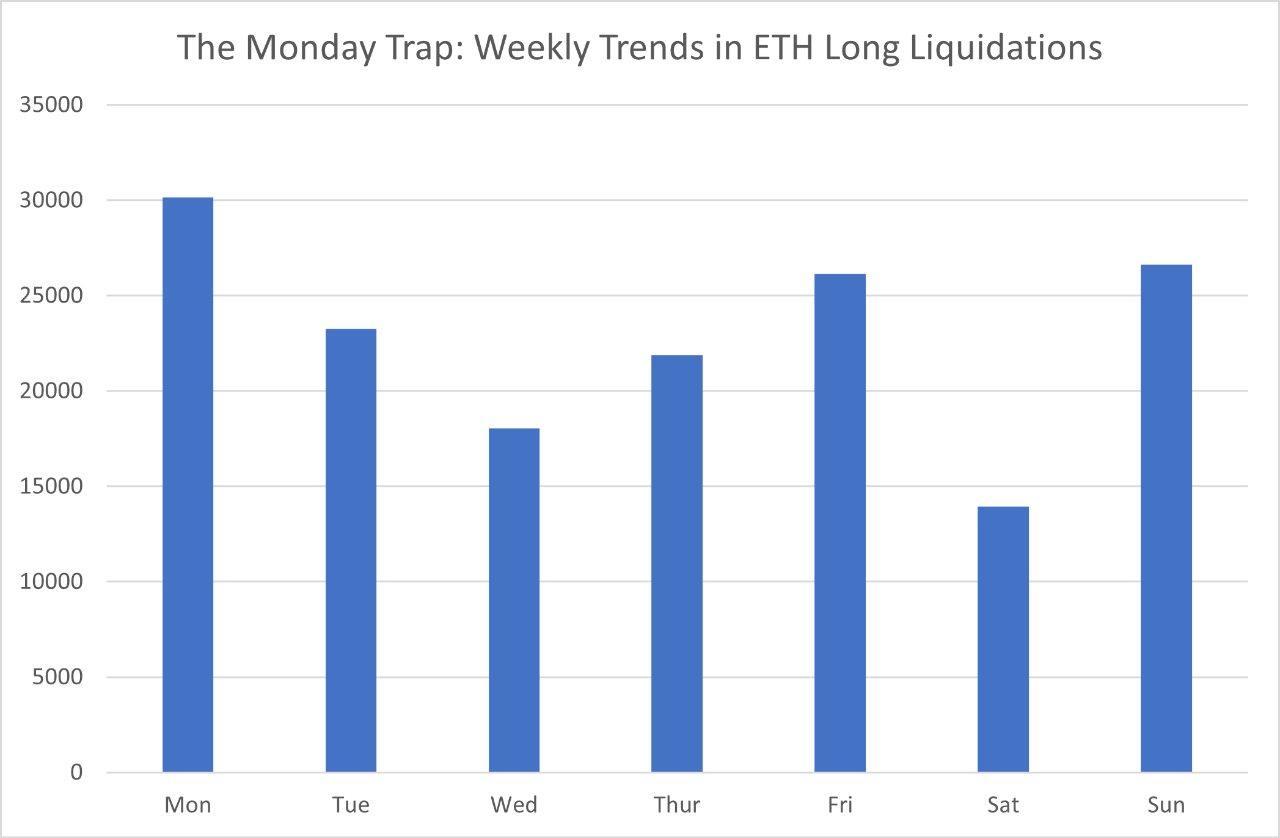
Ethereum Longs at Risk? Analyst Warns of Recurring Weekly Liquidation Pattern
Ethereum (ETH) recently broke through to a new all-time high above $4,900 before undergoing a correc...
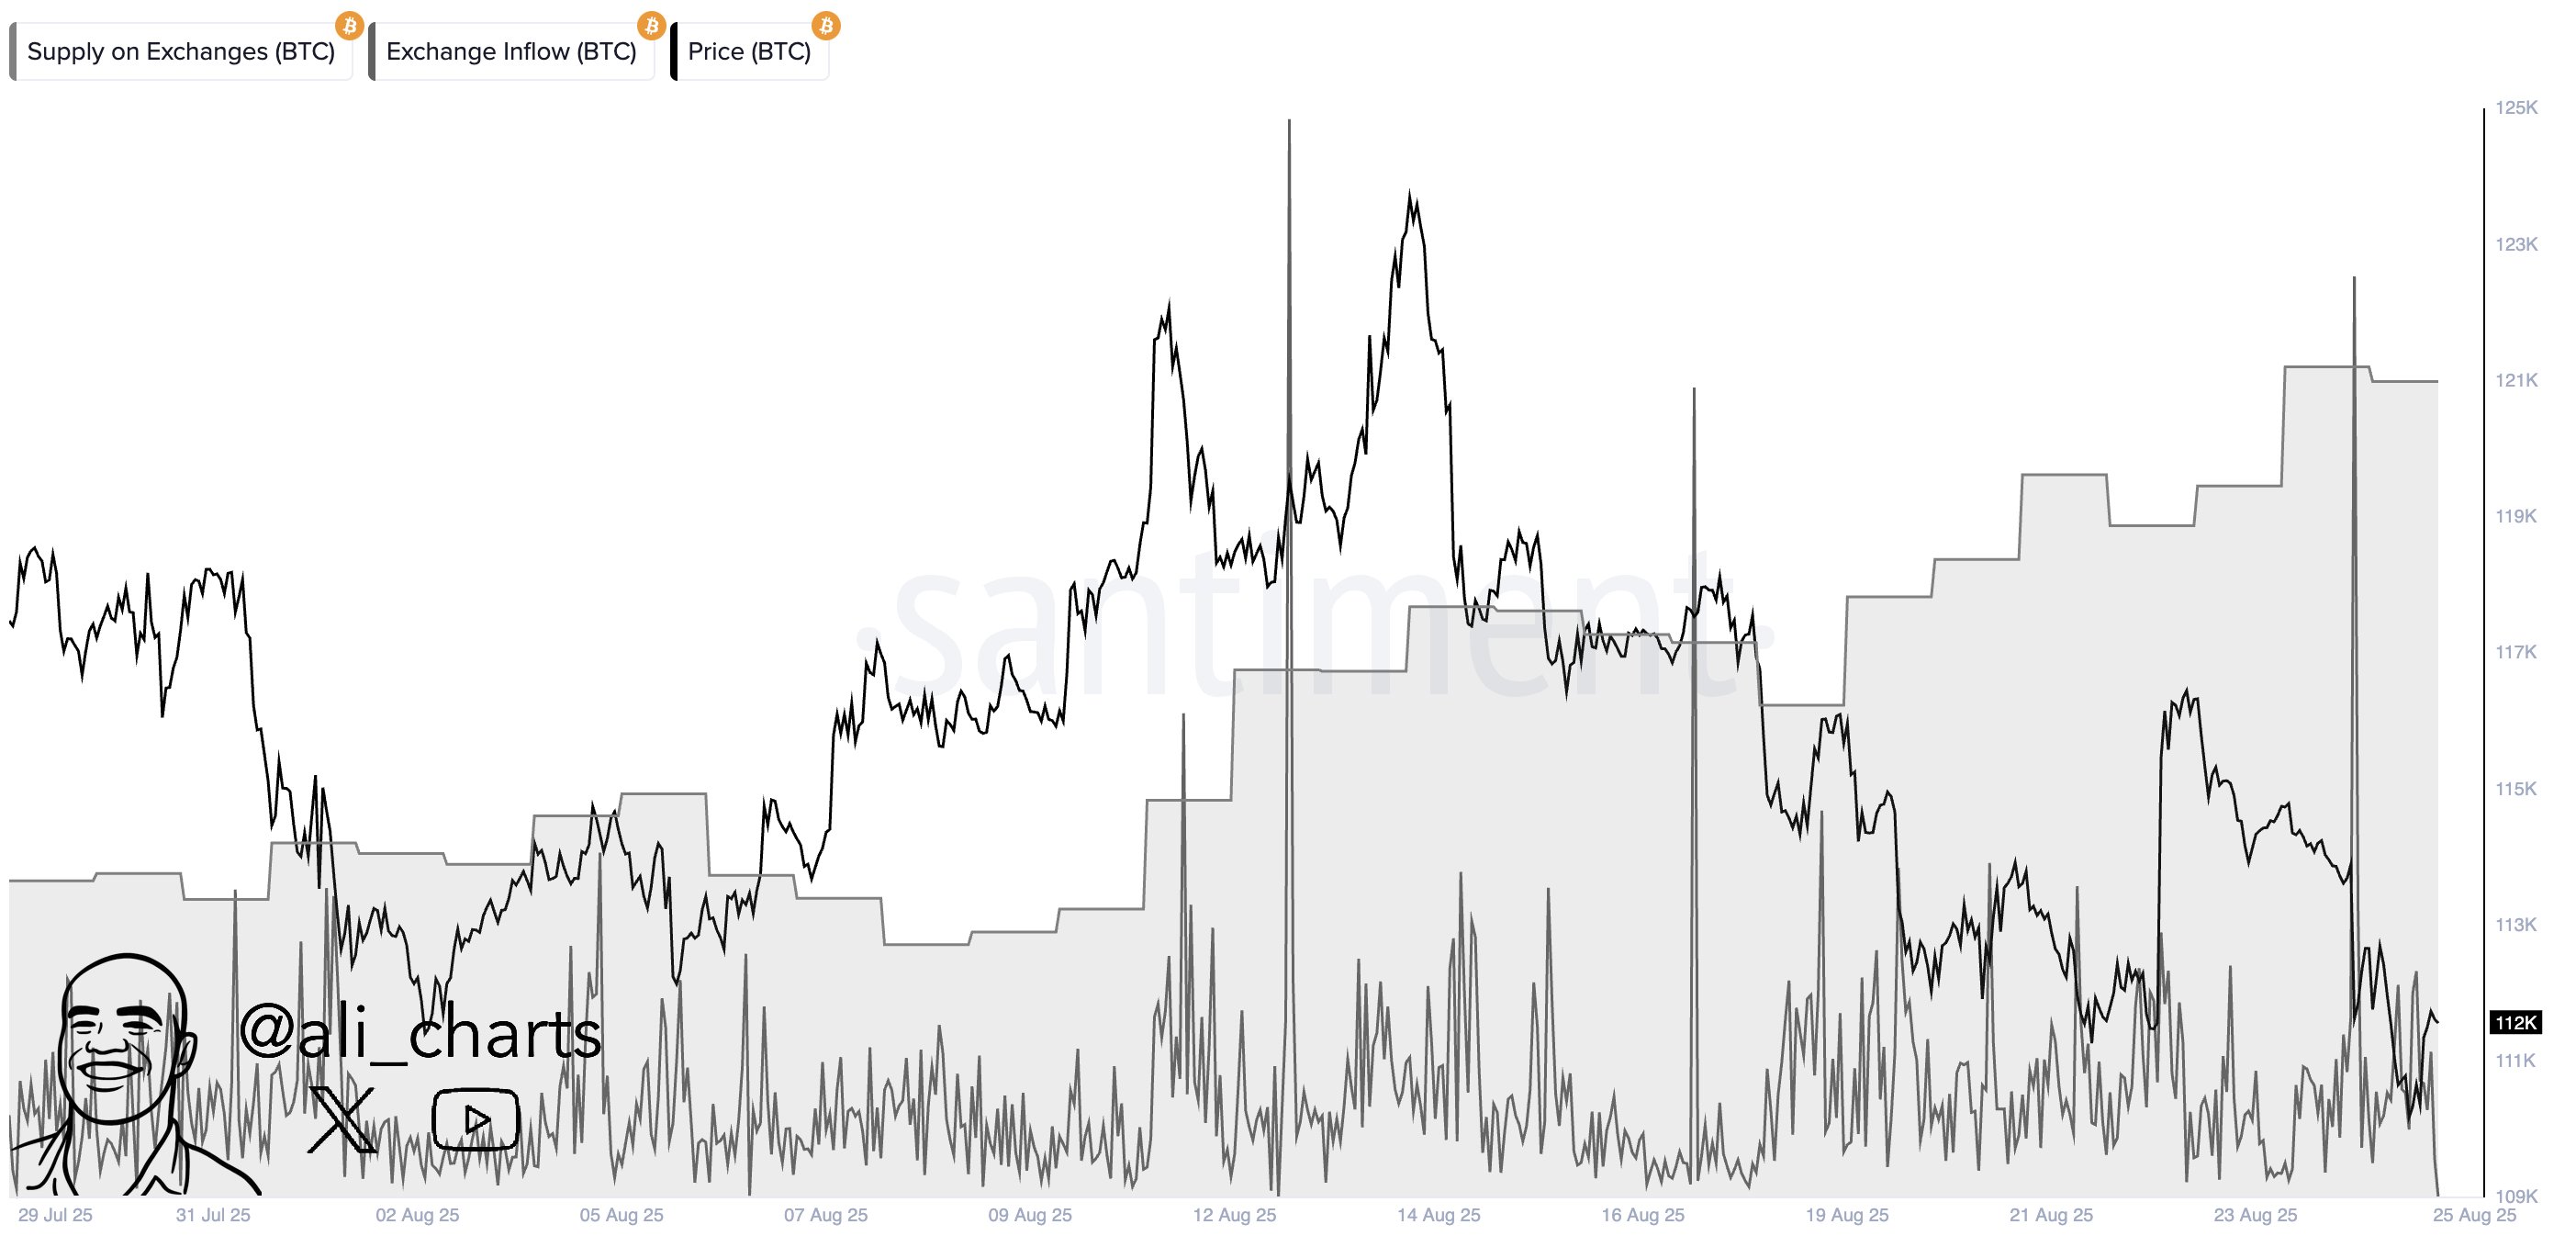
Bitcoin Selloff: $2.2 Billion In BTC Floods Exchanges
On-chain data shows exchanges have received heavy Bitcoin inflows over the last couple of weeks, a p...
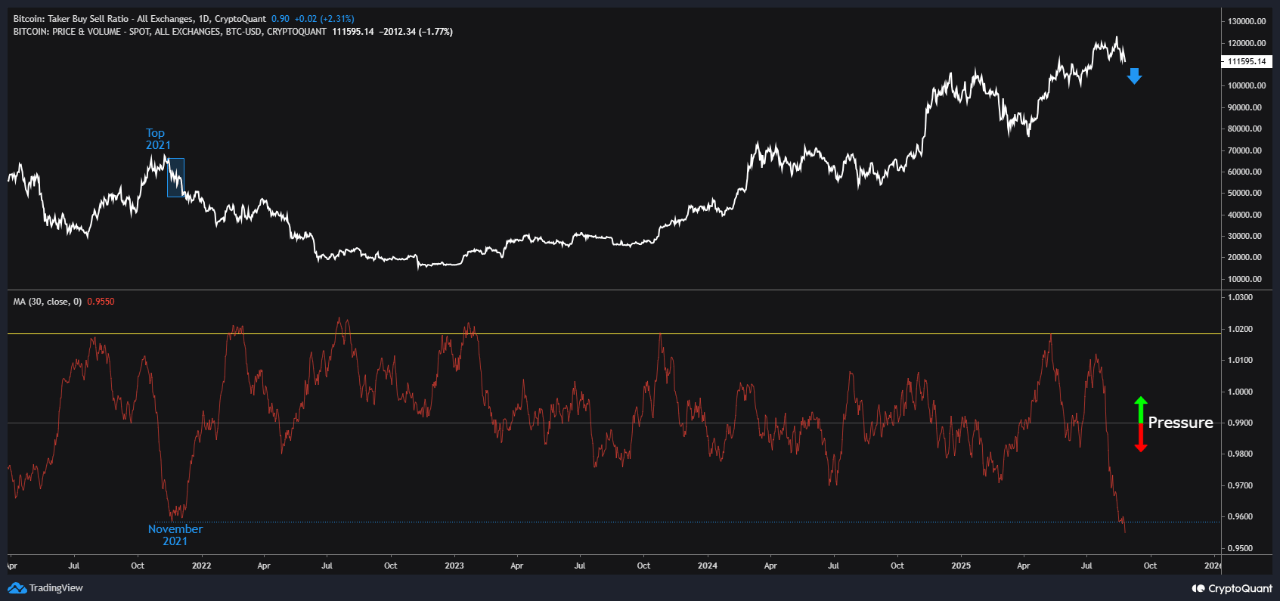
Bitcoin Faces Pressure as Taker Ratio Hits Lowest Level Since Last Cycle’s Peak
Bitcoin (BTC) continues to show signs of weakness after recently setting a new all-time high earlier...