Ethereum Faces Risk As Binance Leverage Ratio Skyrockets To Record Levels


Ethereum is at a decisive moment after a turbulent week of trading. Following a powerful surge on Friday that pushed the price into new highs, ETH quickly faced selling pressure, leading to a sharp drop by Monday. Now, the asset is trying to stabilize above the $4,400 level, a critical zone that bulls must defend to prevent further downside momentum.
The recent volatility highlights how fragile sentiment can become at major turning points. While bulls remain optimistic that ETH can sustain momentum and push toward the long-awaited $5,000 mark, bears argue that the market structure suggests more downside could follow if support fails.
Adding to this uncertainty, analyst Darkfost has issued a warning about rising risks in the derivatives market. According to his analysis, the Binance Estimated Leverage Ratio (ELR) on ETH has reached its highest levels ever recorded, signaling extreme risk conditions. The ELR measures how heavily leveraged positions have become relative to overall open interest.
When leverage skyrockets, markets often experience heightened volatility. Traders taking on excessive risk can trigger forced liquidations, amplifying price swings in both directions. With ETH now sitting at a fragile support level, the combination of leverage buildup and recent price swings makes the coming days critical for Ethereum’s short-term trajectory.
Ethereum Leverage Risks Grow on Binance
According to Darkfost, the Estimated Leverage Ratio (ELR) is one of the most reliable indicators to measure whether a market is becoming dangerously over-leveraged. The ELR combines Open Interest data with overall market activity to highlight the extent to which traders are relying on borrowed funds to amplify their positions.

Recent data shows that Open Interest on Binance just hit a new all-time high of $12.6 billion on August 22, reflecting record speculative activity. For context, back in July 2020, the ELR on Binance was just 0.09, a relatively safe level. Today, that figure has skyrocketed to 0.53, marking the highest reading ever recorded. Such a sharp increase suggests that traders are entering positions with unprecedented leverage.
Darkfost explains that when leverage climbs to these extremes, the short-term market outlook becomes risky. Excessive optimism often leaves participants vulnerable to forced liquidations. Once liquidations cascade, they can magnify price swings far beyond what would happen in a spot-driven move.
Despite heavy institutional and whale accumulation in Ethereum, Binance remains the largest hub for trading activity. With derivatives volumes outweighing spot activity, leveraged positioning now has the power to dictate short-term price moves.
Given that this spike in leverage comes just as Ethereum has broken above its all-time high, the risk of a deleveraging event is high. Such an event could temporarily drive ETH lower, wiping out leveraged positions before the market regains balance. Yet, many analysts believe this would act as a reset, ultimately paving the way for Ethereum to retest and potentially surpass the $5,000 level, which remains the key target for bulls.
Holding Key Support Amid Selling Pressure
Ethereum is currently showing signs of fragility after its strong rally last week. On this 4-hour chart, ETH trades around $4,426, holding near a crucial support zone defined by the 50-day moving average (blue line) at roughly $4,451. Price action shows a sharp rejection from highs above $4,800, followed by a steep retracement that now challenges short-term momentum.
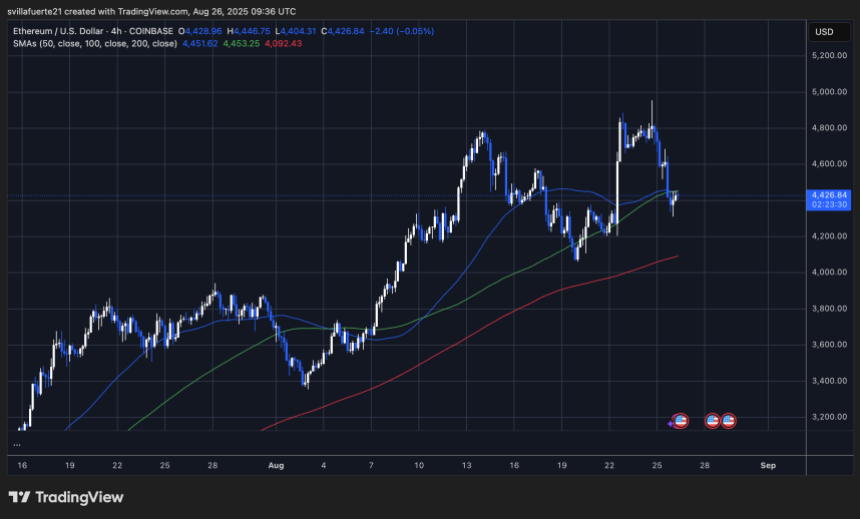
The $4,400 region has emerged as an immediate support level, where ETH is attempting to stabilize. A sustained hold above this area could allow bulls to regroup and attempt another push toward the $4,800–$5,000 resistance zone, which remains the next psychological target. Conversely, if the $4,400 level fails, ETH could slide toward the 100-day moving average (green line) around $4,350, with further downside risk toward the 200-day average (red line) near $4,090.
The structure still favors bulls in the broader trend, but the recent correction highlights the market’s sensitivity to leverage and short-term volatility. For traders, the $4,400 level is key: holding above it keeps the bullish continuation alive, while a breakdown may trigger deeper profit-taking. Overall, ETH remains in an uptrend, but volatility at these levels demands caution.
Featured image from Dall-E, chart from TradingView
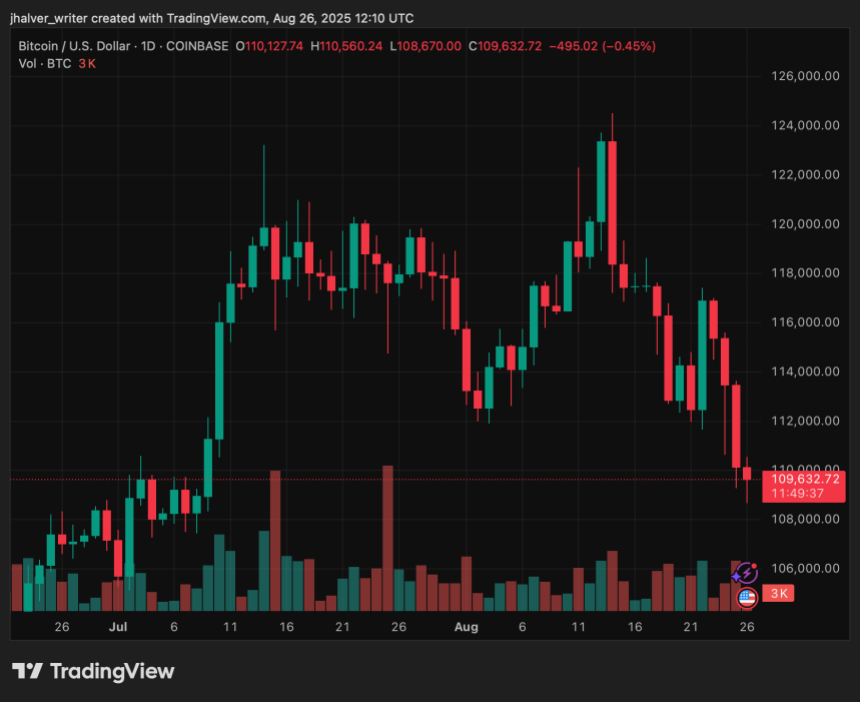
Nearly $1B Wiped Out in Crypto Liquidations: Are Whales Turning the Crash Into a Buying Opportunity?
The crypto market has been rocked by a wave of liquidations totaling nearly $808 million in the past...
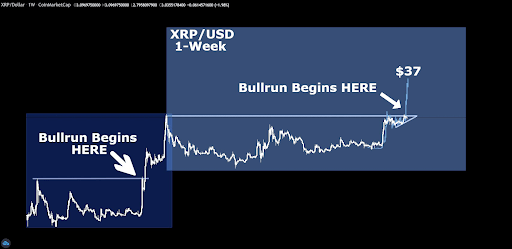
Crypto Analyst Says XRP Bull Run Hasn’t Begun, Sets Course For $37
XRP’s price action this cycle has been full of notable bull runs. However, according to a crypto ana...

Ethereum Is Positioned As The Backbone Of AI-Powered Finance, Here’s Why
Artificial intelligence may be the hottest narrative in tech, but its true financial backbone could ...