XRP Price Crashes Below $3, More Pain for Bulls?


XRP price is gaining bearish pace below the $3.050 resistance zone. The price is struggling below $3.00 and remains at risk of more losses.
- XRP price is declining below the $3.020 and $3.00 levels.
- The price is now trading below $3.00 and the 100-hourly Simple Moving Average.
- There is a bearish trend line forming with resistance at $3.00 on the hourly chart of the XRP/USD pair (data source from Kraken).
- The pair could continue to move down if it stays below the $3.10 zone.
XRP Price Dips In The Red
XRP price remained in a bearish zone after a close below the $3.120 level, like Bitcoin and Ethereum . The price extended losses and traded below the $3.00 support zone.
The price even declined below $2.920. Finally, it tested the $2.850 support zone. A low was formed at $2.850 and the price is now consolidating losses below the 23.6% Fib retracement level of the downward move from the $3.095 swing high to the $2.850 low.
The price is now trading below $3.00 and the 100-hourly Simple Moving Average. On the upside, the price might face resistance near the $2.90 level. The first major resistance is near the $2.920 level.
A clear move above the $2.920 resistance might send the price toward the $3.00 resistance. There is also a bearish trend line forming with resistance at $3.00 on the hourly chart of the XRP/USD pair. It is close to the 50% Fib retracement level of the downward move from the $3.095 swing high to the $2.850 low.
Any more gains might send the price toward the $3.050 resistance. The next major hurdle for the bulls might be near $3.120.
More Downside?
If XRP fails to clear the $2.920 resistance zone, it could start a fresh decline. Initial support on the downside is near the $2.850 level. The next major support is near the $2.80 level.
If there is a downside break and a close below the $2.80 level, the price might continue to decline toward the $2.740 support. The next major support sits near the $2.720 zone, below which there could be a larger decline.
Technical Indicators
Hourly MACD – The MACD for XRP/USD is now gaining pace in the bearish zone.
Hourly RSI (Relative Strength Index) – The RSI for XRP/USD is now below the 50 level.
Major Support Levels – $2.850 and $2.740.
Major Resistance Levels – $2.920 and $3.00.
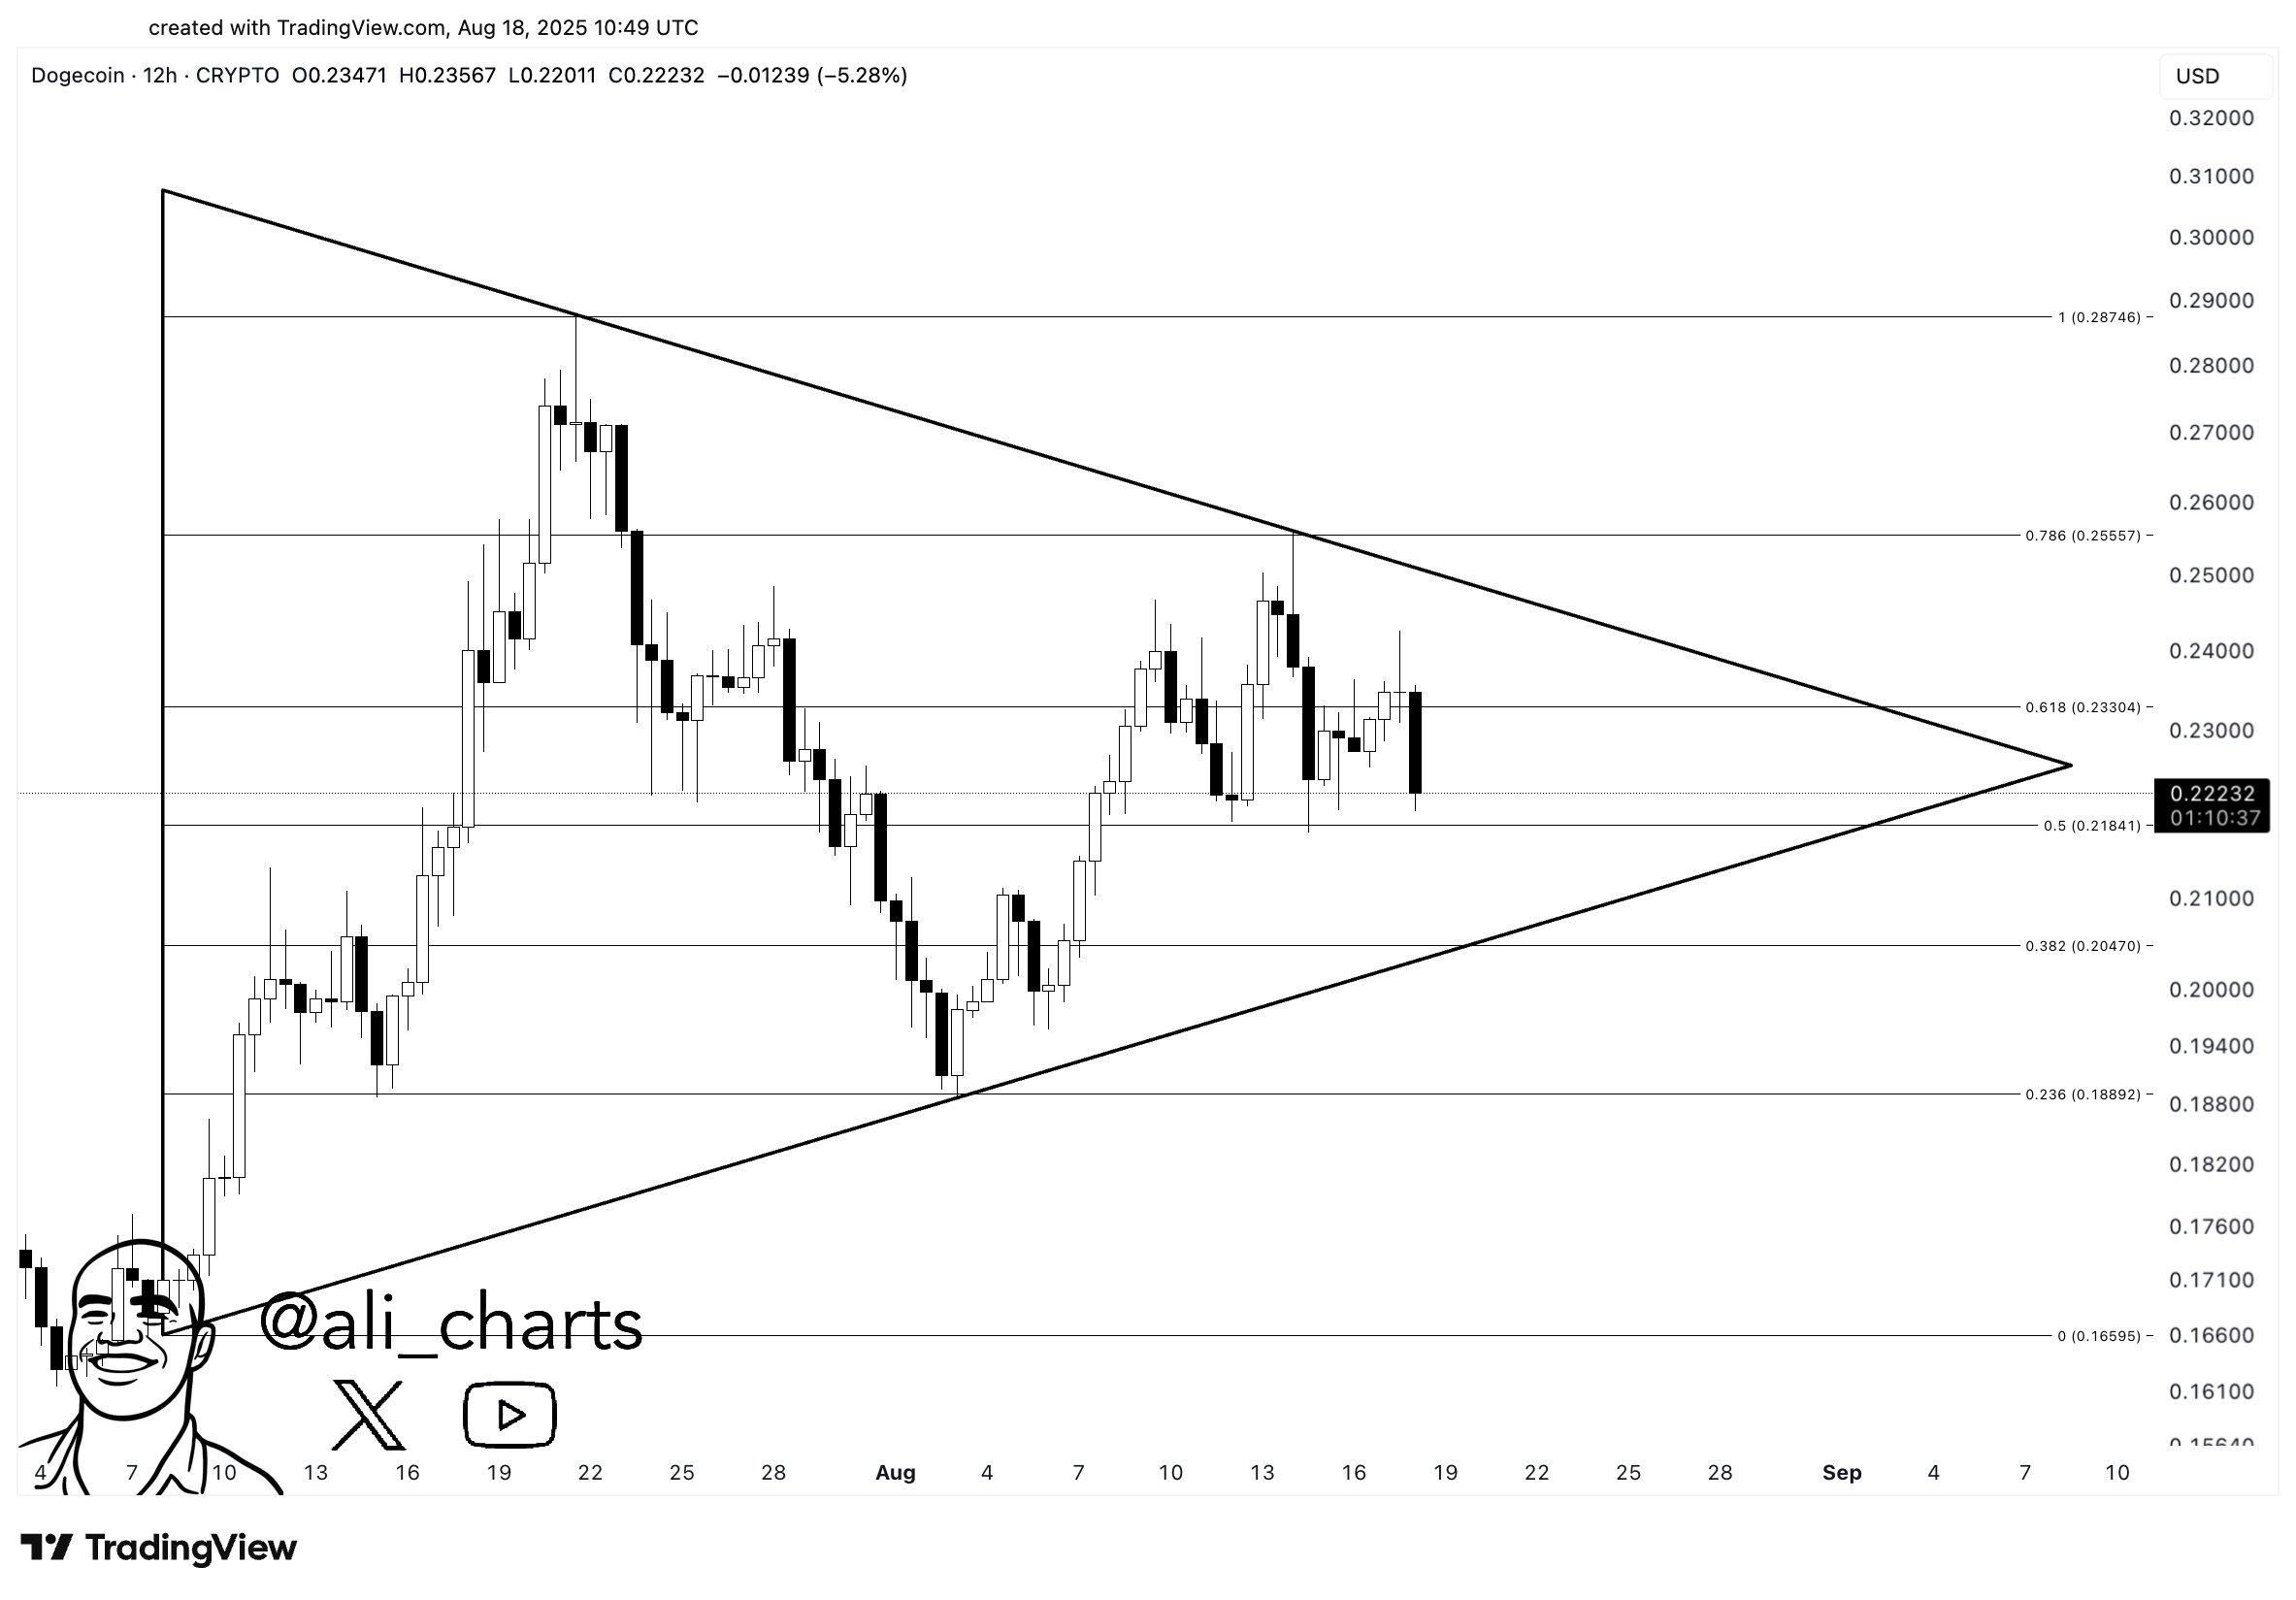
Dogecoin Coils Up: Triangle Break Could Spark 40% Move, Analyst Says
An analyst has pointed out how Dogecoin is consolidating within a triangle pattern that could set up...
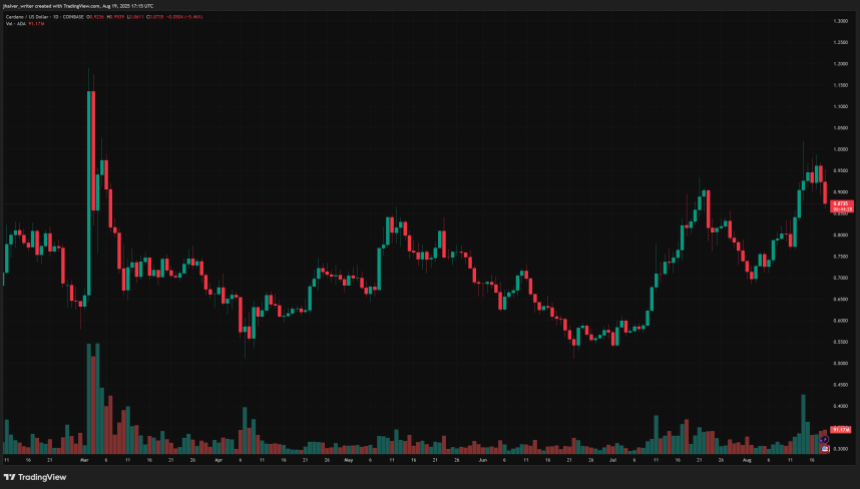
Cardano Defies Market Dip With 20% Weekly Surge: Analysts Eye $10 Target Ahead
While Bitcoin (BTC) and Ethereum (ETH) stumbled in the latest market downturn, Cardano (ADA) has eme...
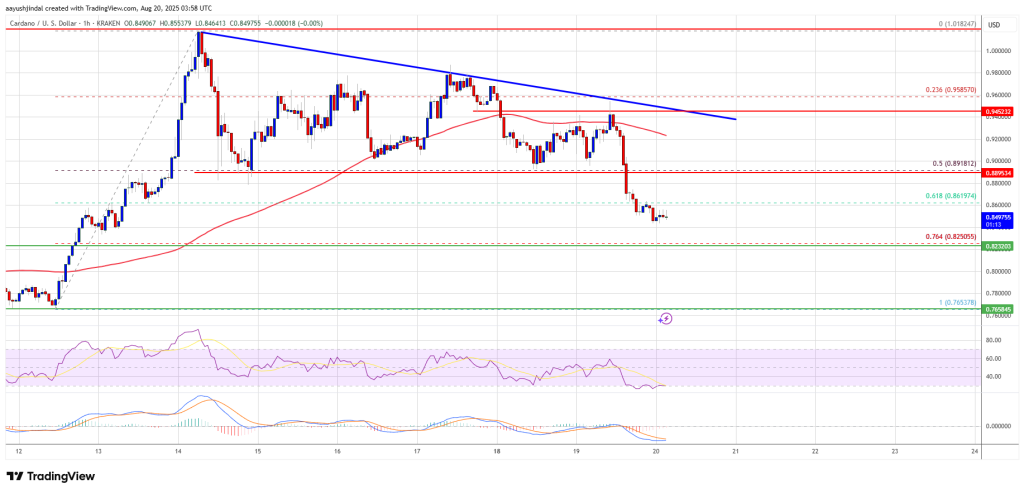
Cardano (ADA) Pulls Back, Will Bears Push It Lower Again?
Cardano price started a downside correction from the $1.020 zone. ADA is now showing some bearish si...