$120K and Rising: What On-Chain Data Says About Bitcoin’s Next Move


Bitcoin has continued its upward momentum over the past week, reclaiming price levels close to its all-time high. At the time of writing, the cryptocurrency is trading above $120,000, only a short distance from the record of more than $123,000.
Over the last seven days, the asset has posted a gain of approximately 5.1%, placing it among the stronger performers in the digital asset market.
Amid the price movement, on-chain data from the TRON network’s USDT transfers is offering insights into current market behavior. CryptoQuant contributor Amr Taha analyzed TRC-20 USDT transaction flows and identified patterns that may serve as potential indicators of Bitcoin price shifts.
By categorizing transactions into six size groups, ranging from retail trades of $100 to large “super whale” transfers exceeding $10 million, the analysis aims to distinguish between everyday market activity and institutional-scale transactions.
Large USDT Transfers as a Market Signal
Taha’s research notes that when transactions exceeding $10 million in USDT on the TRON network surpass $5 billion in a single day, this often coincides with significant profit-taking in Bitcoin.
Such activity typically involves converting BTC into USDT, followed by transferring the stablecoins to private wallets, reducing buying pressure in the spot market.

Past examples include July 16, when $10M+ USDT transfers reached $5.2 billion, followed by a 4.5% decline in BTC, and July 23, when $5.8 billion in similar transfers preceded a 3.8% drop within 48 hours.
Current data, however, shows a lack of such large-scale transactions, suggesting that major holders are not actively selling into stablecoins at present. This absence of substantial whale outflows may indicate that large investors are maintaining positions rather than exiting the market.
Bitcoin Shifting Market Participation and Potential Breakout Scenarios
A separate analysis from CryptoQuant’s ShayanMarkets examined the average executed order size in Bitcoin futures markets, providing another perspective on participation trends.
This metric, which divides total traded volume by the number of executed orders, helps identify whether activity is being driven by retail participants or larger, institutional traders.
Data from late 2024 and early 2025 showed periods of whale dominance, which coincided with strong rallies. In contrast, recent weeks have seen a rise in smaller, retail-sized orders, while whale-driven trades have diminished.

This shift suggests that large-scale buyers may be holding positions acquired at lower price levels or waiting for new market conditions before re-entering with significant volume.
Historically, extended whale dominance near market highs has often been associated with distribution phases, where large holders take profits.
The current absence of such behavior leaves open the possibility of a bullish breakout above Bitcoin’s previous all-time high, provided that renewed selling pressure from large investors does not emerge in the near term.

Featured image created with DALL-E, Chart from TradingView
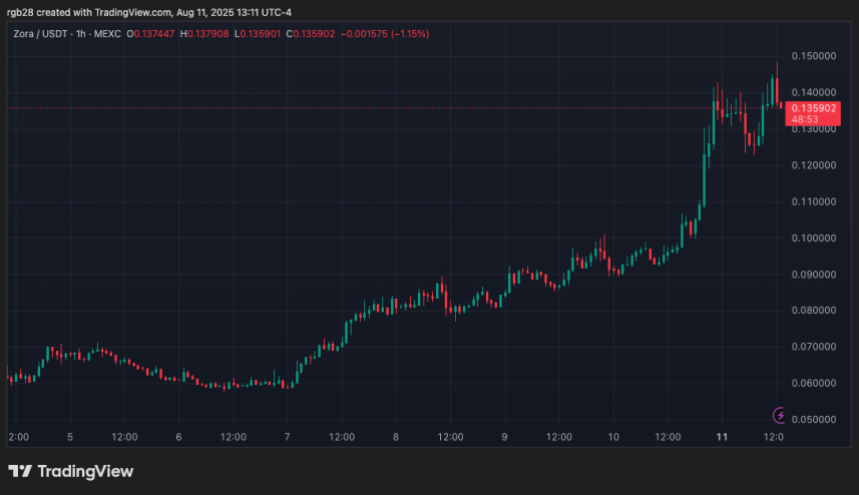
ZORA Hits New ATH Amid 50% Daily Surge – What’s Behind The Breakout?
Social Network Zora has seen its native token, ZORA, record a massive rally following a spike in use...
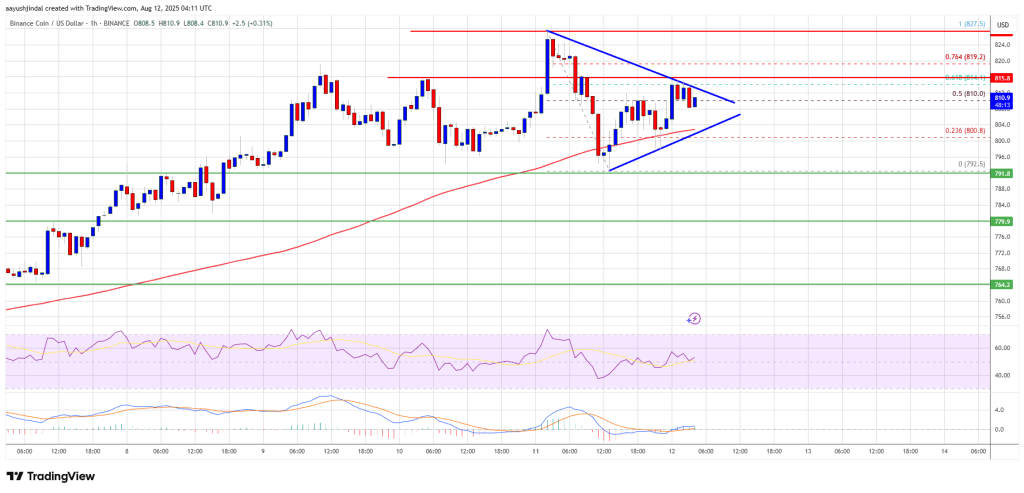
BNB Price Coiling for Breakout—Next Leg Higher in Sight
BNB price is correcting gains from the $825 zone. The price is now facing hurdles near $815 and migh...
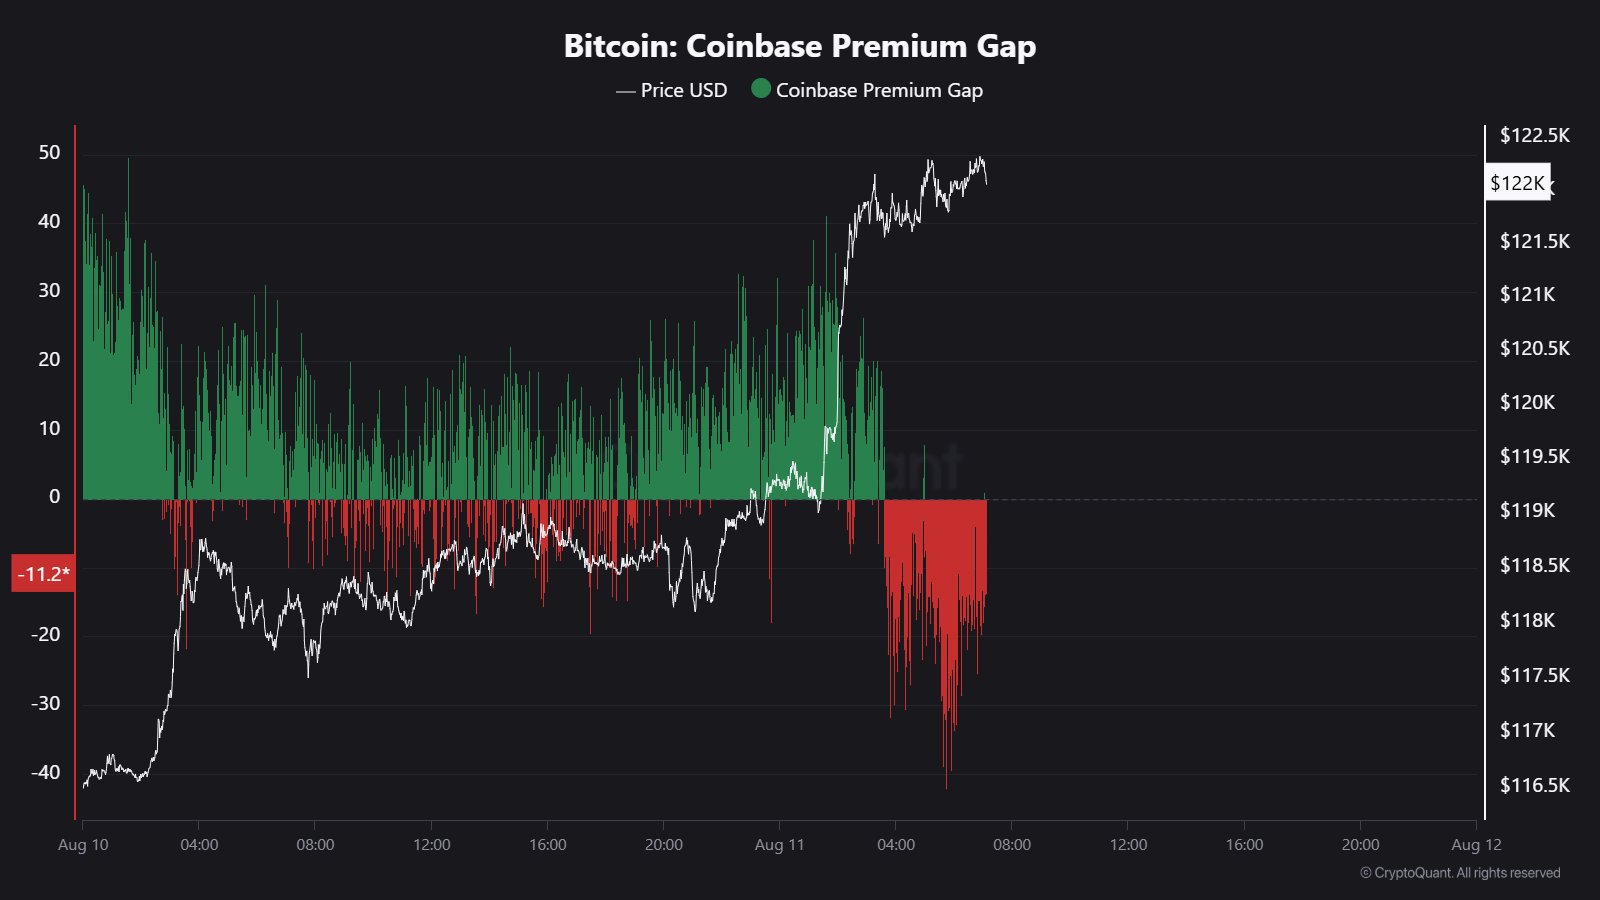
Bitcoin Retraces Below $120,000: Is Coinbase Selling To Blame?
Bitcoin has seen a retrace back below the $120,000 level as data shows the Coinbase Premium Gap has ...