Bitcoin’s Macro Mirror: Global Liquidity Trends Hint At Bullish Continuation


Bitcoin ’s price movements often reflect broader macroeconomic trends. Analysts have uncovered a consistent pattern where BTC’s price follows these shifts with a roughly 12-week delay. With global liquidity now picking up steam, the macro-level signal now points toward a potential bullish phase ahead for BTC.
How Liquidity Trends Fit Into Bitcoin’s Long-Term Cycle
In an X post , Crypto expert MartyParty pointed out a compelling pattern in Bitcoin’s price behavior, stating that its high-timeframe follows global liquidity, indicated on the chart as the blue line following the red line lagged 12 weeks.
Currently, the global liquidity curve is on the rise, and the US has not started issuing new liquidity, meaning the current surge is being fueled externally. MartyParty argues that this global liquidity wave is primed to push BTC toward the $125,000 mark on foreign liquidity issuance.
The current macro thesis suggests that BTC could reach $140,000, driven purely by the influx of foreign liquidity. In the meantime, the upcoming US liquidity issuance is expected to begin within the next quarter and will last up to a year to eighteen months.
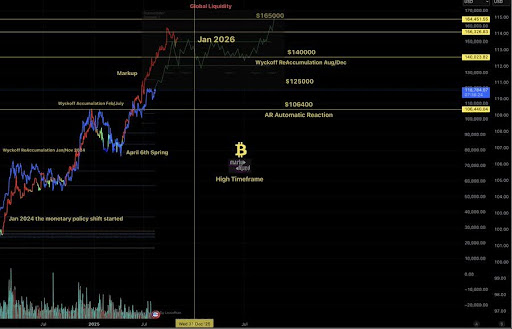
Once the US liquidity kicks in, combined with expected rate cuts that will lower borrowing costs, it will create a compelling setup for the BTC price to potentially rally to $250,000 in the medium to long term.
Daan Crypto Trades has revealed that Bitcoin’s impressive resilience and steady upward trend relative to the US stock market have been trending since its bottom in 2022. Over this period, BTC has experienced only four moderate corrections ranging between 20% and 30%, while delivering a 420% gain from bottom to top. This steady outperformance suggests that BTC has carved out a strong position as a growth asset, especially in risk-on market environments.
How Bitcoin’s Current Energy Value Growth Differs From Past Cycles
Another notable development is the Bitcoin Energy Value, which just reached a new all-time high of $135,000 per BTC. According to StarPlatinum, in previous market cycles, reaching such peaks in Energy Value has been associated with sharp price moves or big drops.
Currently, the rise in Energy Value is gradual and steady, reflecting a more natural market progression. This data reveals several key points about BTC’s current state. First, BTC is stronger and more mature than ever, with demand steadily increasing over time.
Despite hitting a new all-time high on Energy Value, the current price still sits about 15% below this metric, indicating there’s still room to run. Historically, the BTC cycle top occurred when its price surged 40% to 60% above its Energy Value. Meanwhile, many in the crypto community have spent three years saying BTC is close to the top, only to see those calls followed by waves of FOMO.


Chainlink Tipped To Outshine XRP In Global Banking Links: Analyst
Chainlink’s growing role in SWIFT’s blockchain integration is drawing comparisons to XRP’s long-stan...
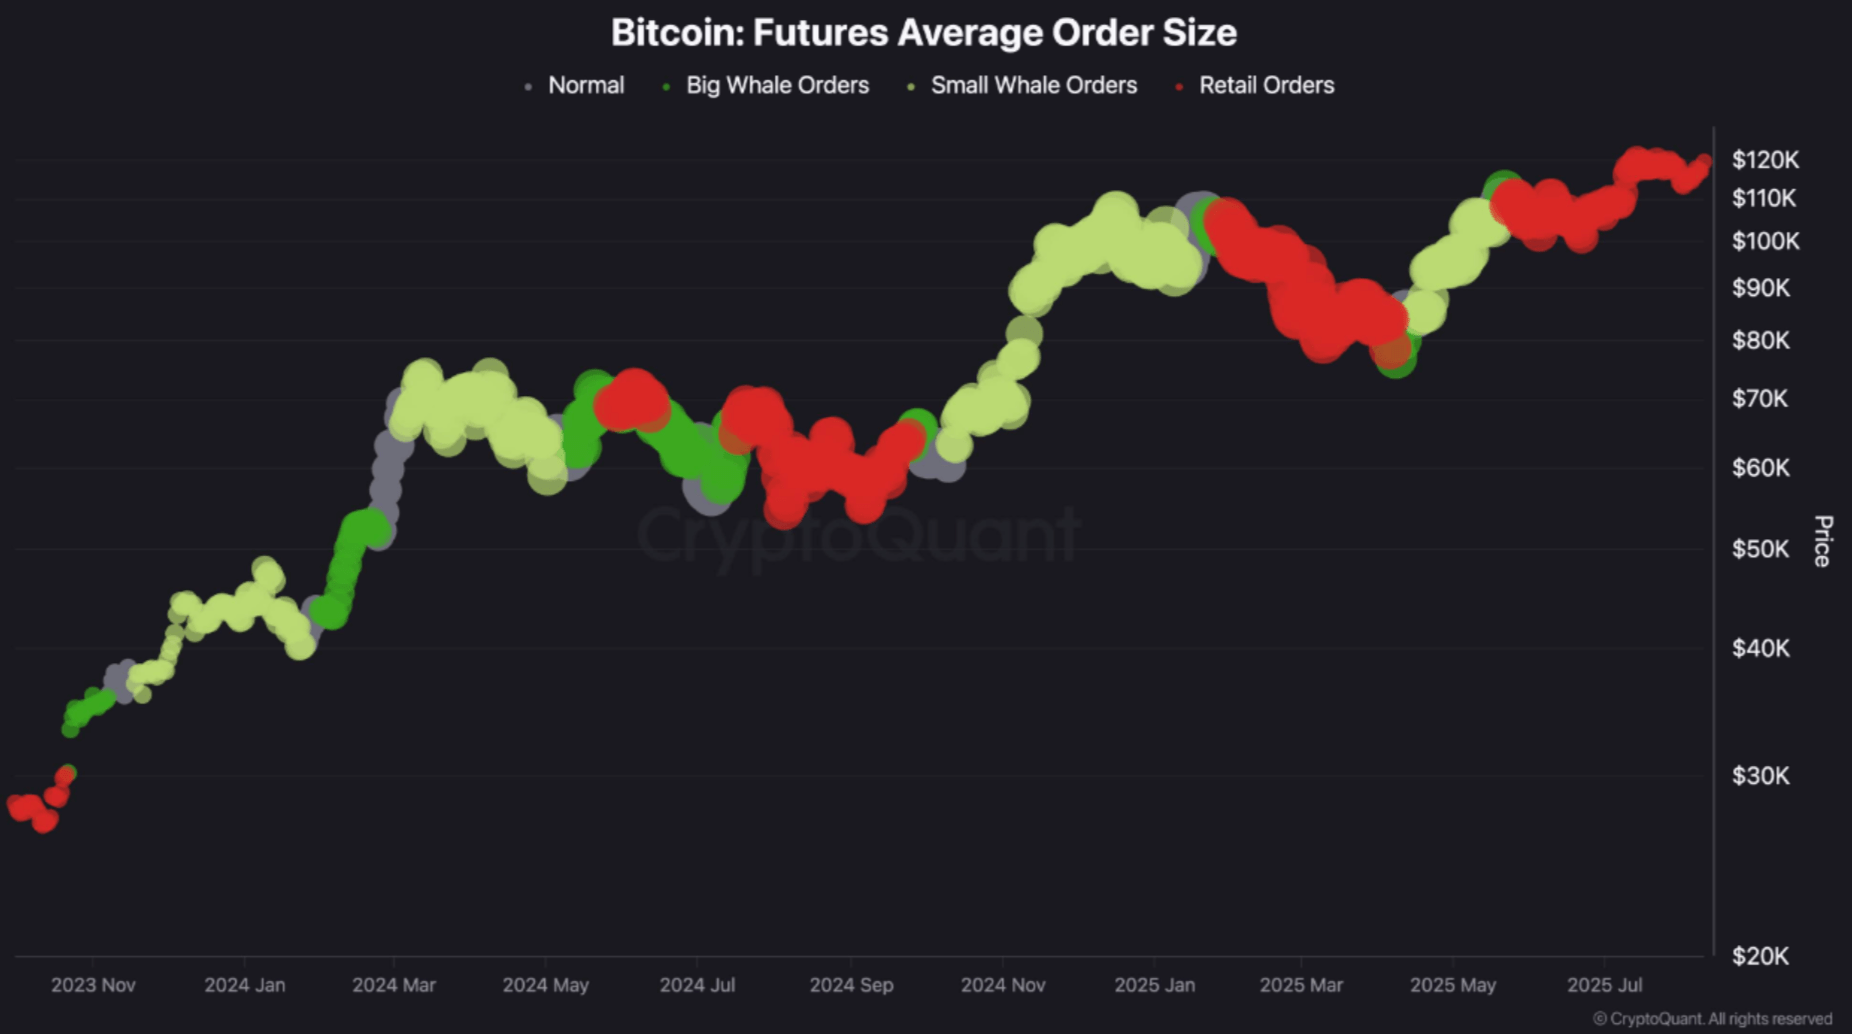
Bitcoin Price Eyes ATH With Falling Average Executed Order Size And Rising Retail Activity
Earlier today, Bitcoin (BTC) surged past $122,000 for the first time since July 13, coming close to ...
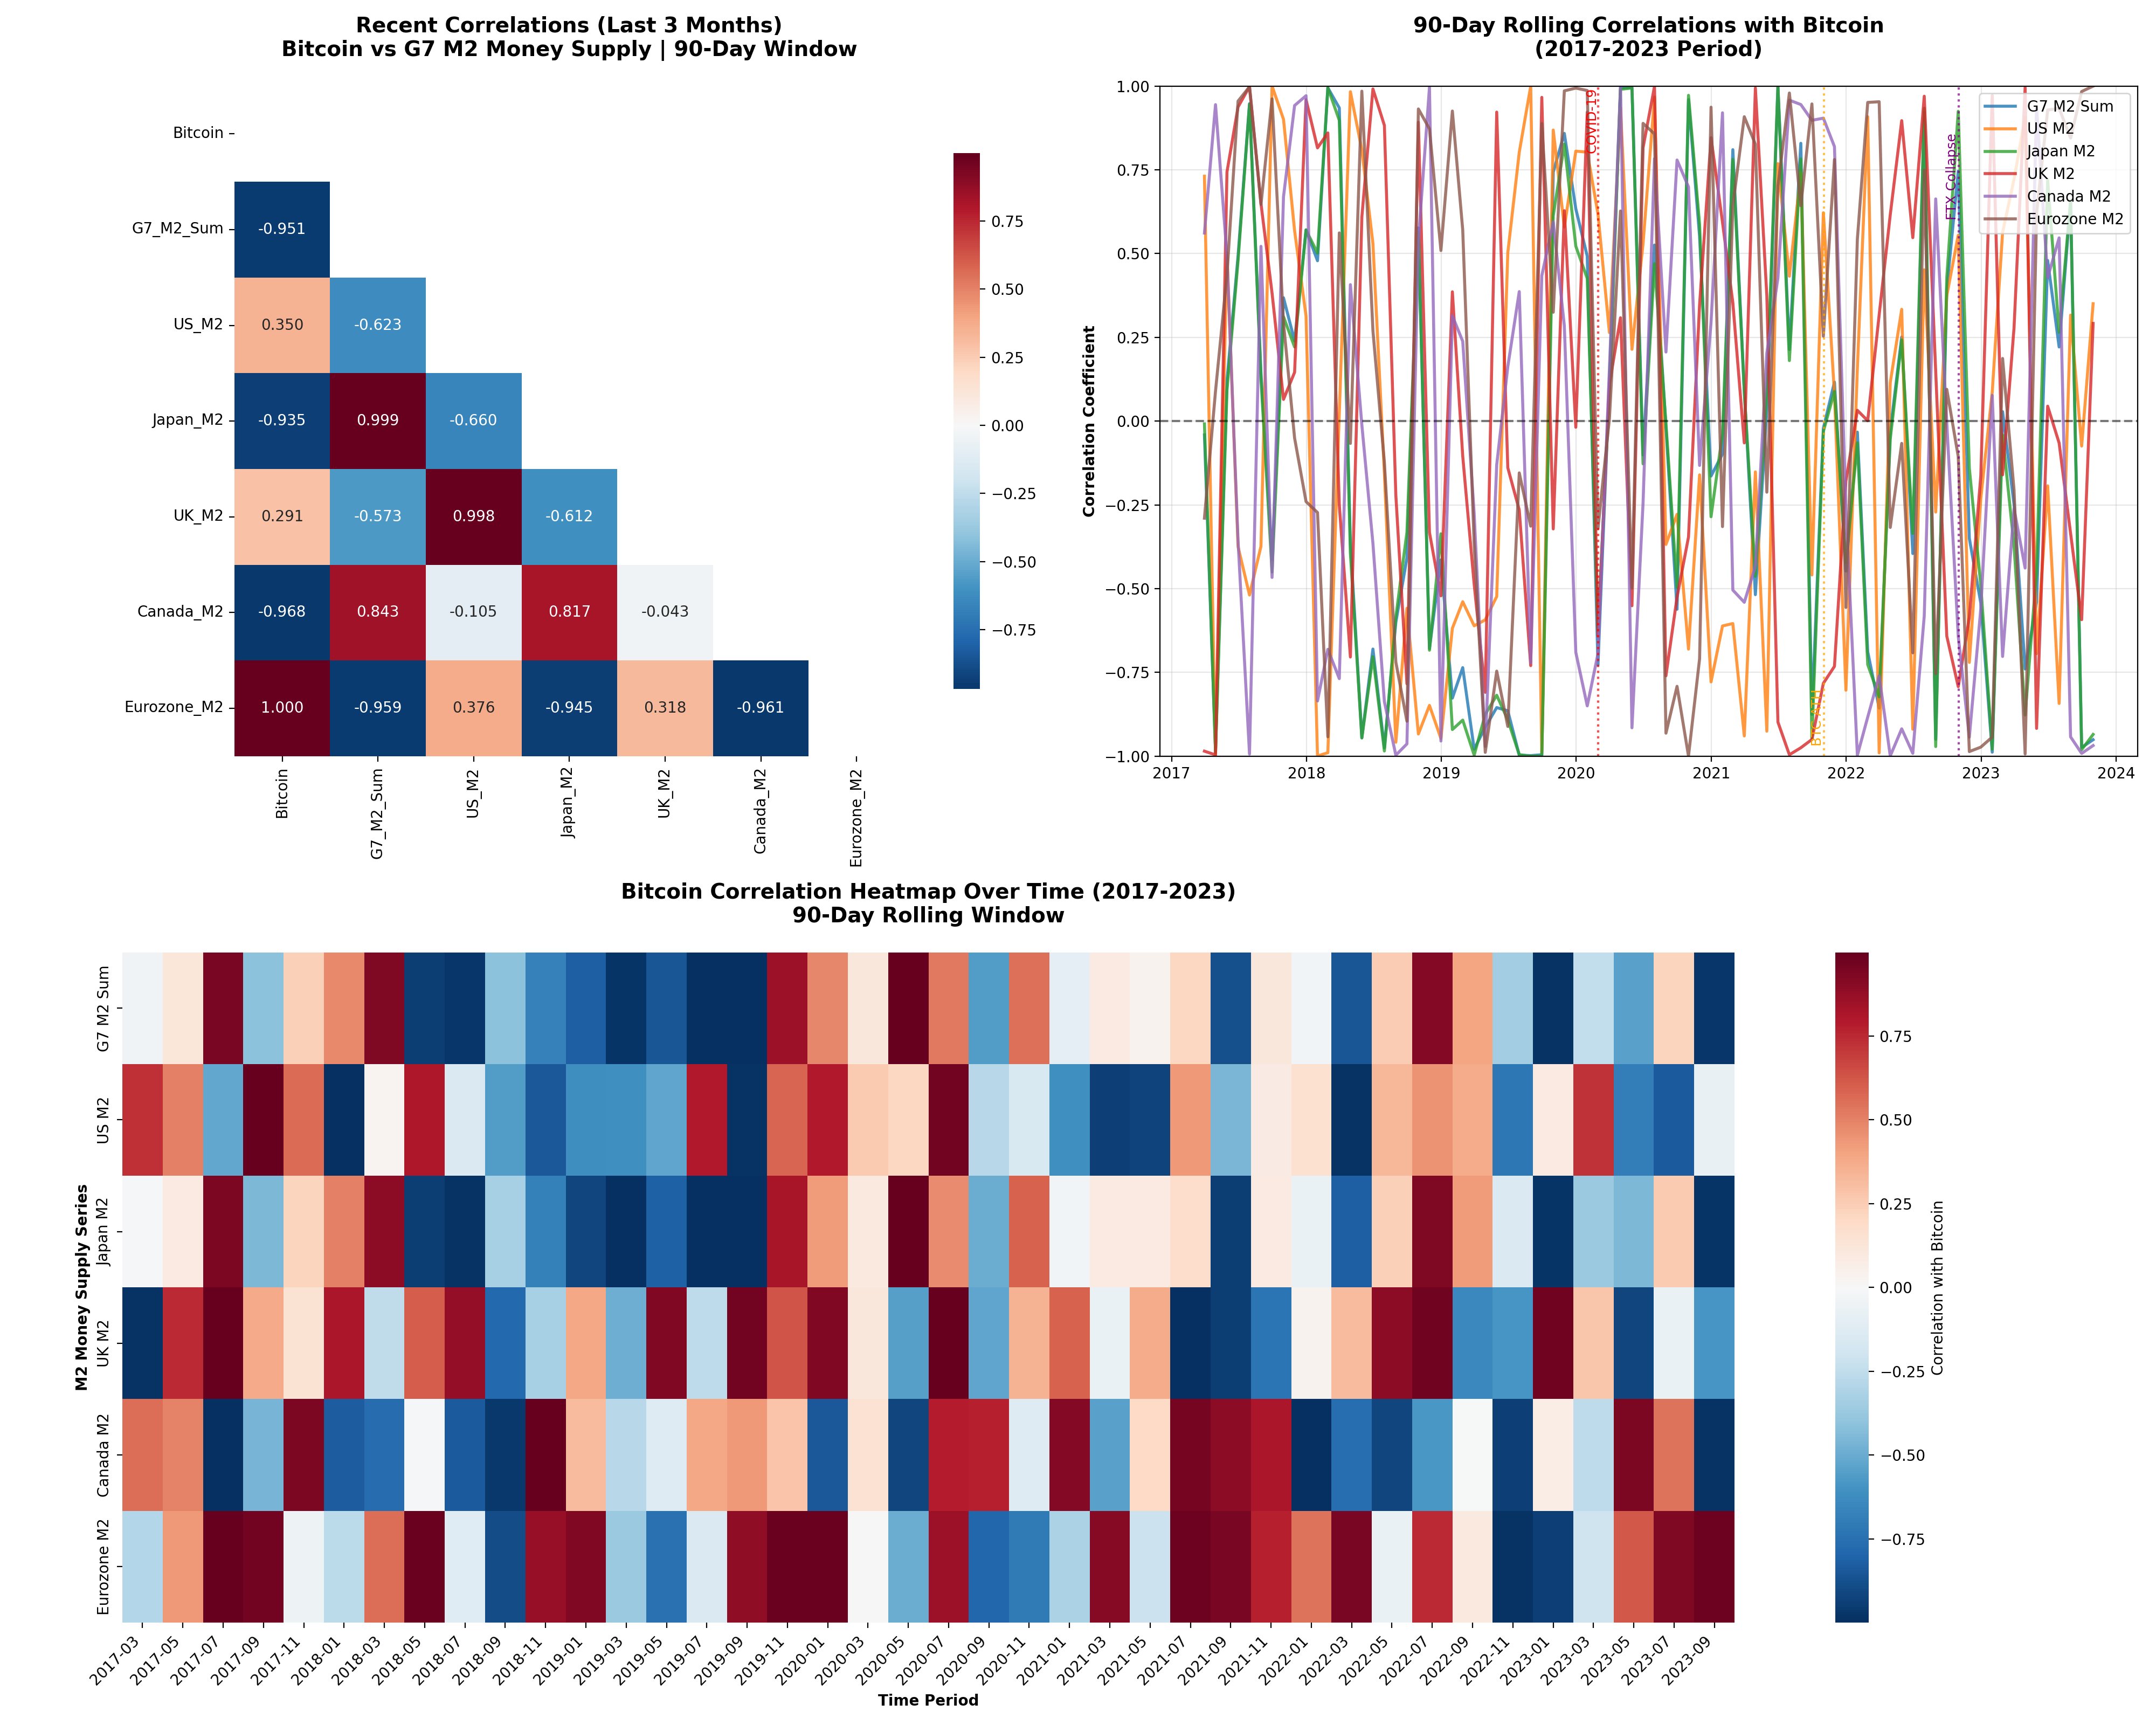
Bitcoin-Money Supply Link Is A Myth, Glassnode Researcher Reveals
A senior researcher at Glassnode has challenged the idea that the Bitcoin price is correlated to US ...