BNB Price Corrects Gains After Strong Rally – Is It Just a Healthy Pullback?


BNB price is correcting gains from the $860 zone. The price is now facing hurdles near $820 and might dip again toward the $788 support.
- BNB price is correcting gains and traded below the $820 support zone.
- The price is now trading below $810 and the 100-hourly simple moving average.
- There is a key bullish trend line forming with support at $800 on the hourly chart of the BNB/USD pair (data source from Binance).
- The pair must stay above the $788 level to start another increase in the near term.
BNB Price Trims Some Gains
After a steady increase, BNB price failed to clear the $860 zone. There was a downside correction below the $850 and $680 levels, like Ethereum and Bitcoin .
The price even dipped below $840 and tested $800. There was a clear move below the 23.6% Fib retracement level of the upward move from the $744 swing low to the $861 high. The bulls are now active near the $800 support zone.
There is also a key bullish trend line forming with support at $800 on the hourly chart of the BNB/USD pair. The price is now trading below $810 and the 100-hourly simple moving average.
On the upside, the price could face resistance near the $810 level. The next resistance sits near the $820 level. A clear move above the $820 zone could send the price higher. In the stated case, BNB price could test $845. A close above the $845 resistance might set the pace for a larger move toward the $860 resistance. Any more gains might call for a test of the $880 level in the near term.
More Losses?
If BNB fails to clear the $820 resistance, it could start another decline. Initial support on the downside is near the $800 level. The next major support is near the $788 level.
The main support sits at $770. If there is a downside break below the $770 support, the price could drop toward the $750 support. Any more losses could initiate a larger decline toward the $735 level.
Technical Indicators
Hourly MACD – The MACD for BNB/USD is gaining pace in the bearish zone.
Hourly RSI (Relative Strength Index) – The RSI for BNB/USD is currently below the 50 level.
Major Support Levels – $800 and $788.
Major Resistance Levels – $810 and $820.
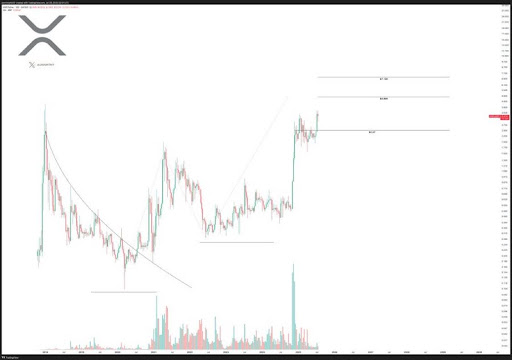
XRP Price To Climb 44% To $4.804 As Long As This Level Holds
The XRP price is gaining traction once again as bullish signals strengthen across the charts. Follow...
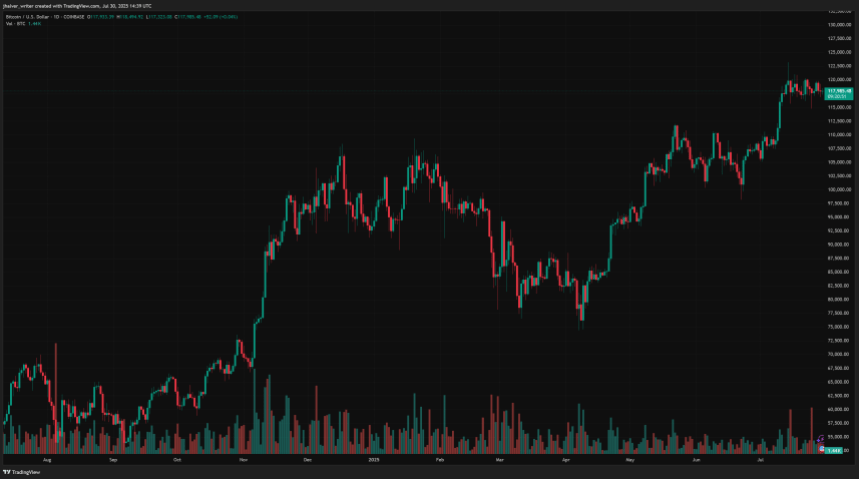
Bitcoin Drops Below $118.5K as Fed Decision and Tariff Fears Shake Crypto Market
Bitcoin faced renewed selling pressure on Wednesday, falling 0.45% to $118,446.5 as traders braced f...

Cardano Eyes 1,000x Explosion—Hoskinson Says Bitcoin’s Out Of Steam
Cardano founder Charles Hoskinson made headlines this week with a bold forecast. He told investors t...