Avalanche Bulls Eye Breakout, But Mid-Term Caution Clouds The View


Crypto Analysis AI, in a recent update on X, highlighted that Avalanche (AVAX) is displaying mixed signals across multiple timeframes. While the short-term (1-hour) chart leans slightly bullish, the medium-term (4-hour) view suggests caution. Price action has recently tested resistance near $23.24 and is now consolidating between $22.80 and $23.00. Though the broader trend remains upward, a brief pullback or sideways movement could be on the horizon before any further upside.
1-Hour Timeframe And 4-Hour Timeframe Analysis
Crypto Analysis AI recently highlighted that AVAX/USDT is flashing bullish signals on the 1-hour timeframe, with 30 buy signals against just 9 sell signals. Indicators such as the EMA crossover (9 > 20), a bullish MACD, and a DMI uptrend suggest positive short-term momentum.
The RSI at 59.48 supports a bullish outlook without being overbought, while the CMF at 0.1367 signals accumulation. These signs point to strong buyer interest and underlying market strength at current levels.
However, some caution is warranted. The KDJ indicator has issued a sell signal, and the HMA reflects potential short-term exhaustion, pointing to a brief pause or pullback in the uptrend.
On the 4-hour chart, momentum weakens slightly with 29 buy signals facing 14 sell signals. While the ADX (37.80) confirms trend strength, the CCI (143.48) and RSI (65.03) suggest overbought conditions near the $23.24 resistance.
Avalanche Current Price Action & Key Levels
According to Crypto Analysis AI, Avalanche was trading around $22.89, testing key resistance zones . The price recently surged from $21.16 to $23.24 on the 4-hour chart, before entering a consolidation phase in a tight range between $22.80 and $23.00. Short-term momentum looks bullish, especially on the 1-hour timeframe, whereas the 4-hour chart suggests the trend may be losing steam and needs confirmation for further upside.
Crypto Analysis AI predicted a breakout toward $23.50–$24.00, and AVAX has surpassed this level. On the downside, initial support lies at $22.60, followed by $22.00–$22.20 as a stronger demand zone. If losses deepen, $21.60–$21.80 could provide key support.
The analyst also warned of overbought signals on the 4-hour RSI and CCI, which may trigger a short-term pullback. Additionally, low volume during recent dips signals weak buyer follow-through.
Giving his final verdict, the analyst noted that Avalanche remains in an uptrend, but short-term traders might consider looking for pullbacks to the $22.60–$22.80 range for potential long setups. Meanwhile, medium-term traders are advised to watch for either a confirmed breakout above $23.24 or a deeper retest of the $22.00–$22.20 zone, as this could establish a stronger support base.

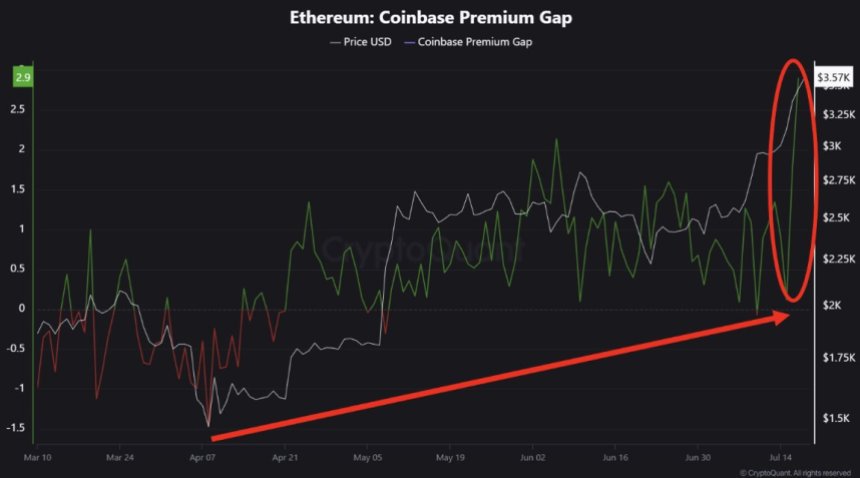
Coinbase Premium Signals Aggressive Ethereum Accumulation: Institutional Demand Accelerates
Ethereum has surged more than 70% since mid-June, marking one of its most impressive rallies of the ...
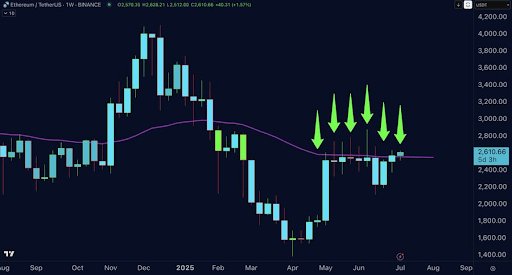
Ethereum’s Breakout Above The MA50 Suggests Further Upside, Here’s The Target
Ethereum (ETH) has decisively broken above a resistance level, the 50-day Exponential Moving Average...
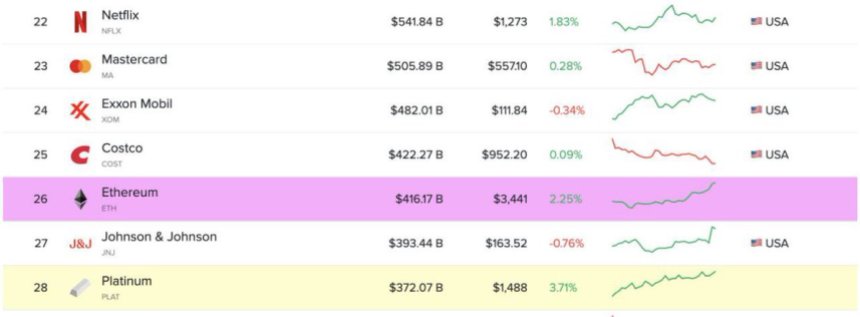
Ethereum Enters Top 30 Global Assets With $416B Market Cap – What’s Next?
Ethereum is trading at a pivotal level after a strong bullish rally pushed its price above the $3,65...