Bitcoin Next Key Level Is $136,000 If Momentum Holds, Glassnode Says


The on-chain analytics firm Glassnode has pointed out how $136,000 could be the next price level of importance for Bitcoin, if current momentum continues.
This Bitcoin Short-Term Holder Cost Basis Level Is Situated At $136,000
In a new thread on X, Glassnode has discussed what a few different on-chain indicators suggest regarding where Bitcoin is in the current cycle. The first metric shared by the analytics firm is the Short-Term Holder (STH) Cost Basis , which measures the average acquisition price of the investors who purchased their coins within the past 155 days.
Below is a chart showing the trend in this metric over the last couple of years.
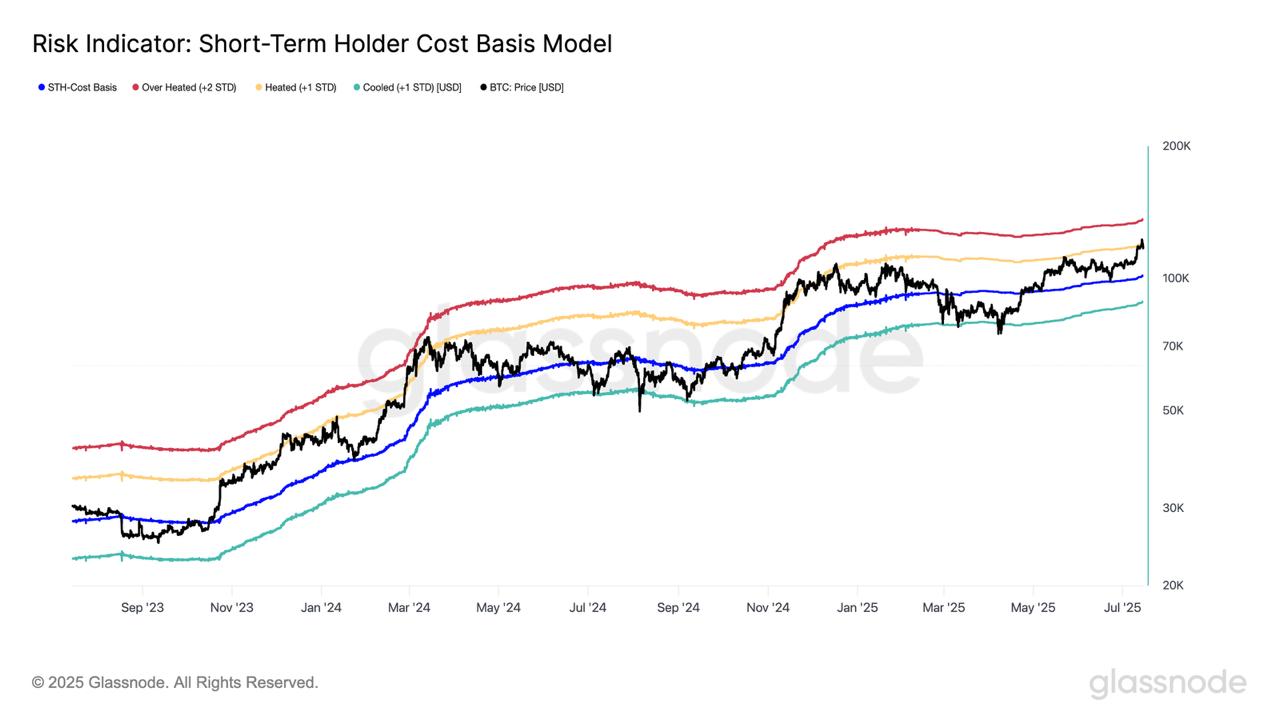
As displayed in the graph, the Bitcoin price broke above the STH Cost Basis earlier in the year and has since remained above the line, indicating the STHs as a whole have been in a state of net profit.
In the same chart, the analytics firm has also marked a few other levels, each corresponding to a specific standard deviation (SD) from the STH Cost Basis. With the recent price surge to a new all-time high (ATH) above $123,000, BTC was able to breach the +1 SD level, which has historically corresponded to heated market conditions.
After the pullback, though, the coin has returned below the mark, but still remains close to it. “If this momentum continues, the next key level is $136k (2 +std), a zone that has historically marked elevated profit-taking and local market peaks,” explains Glassnode.
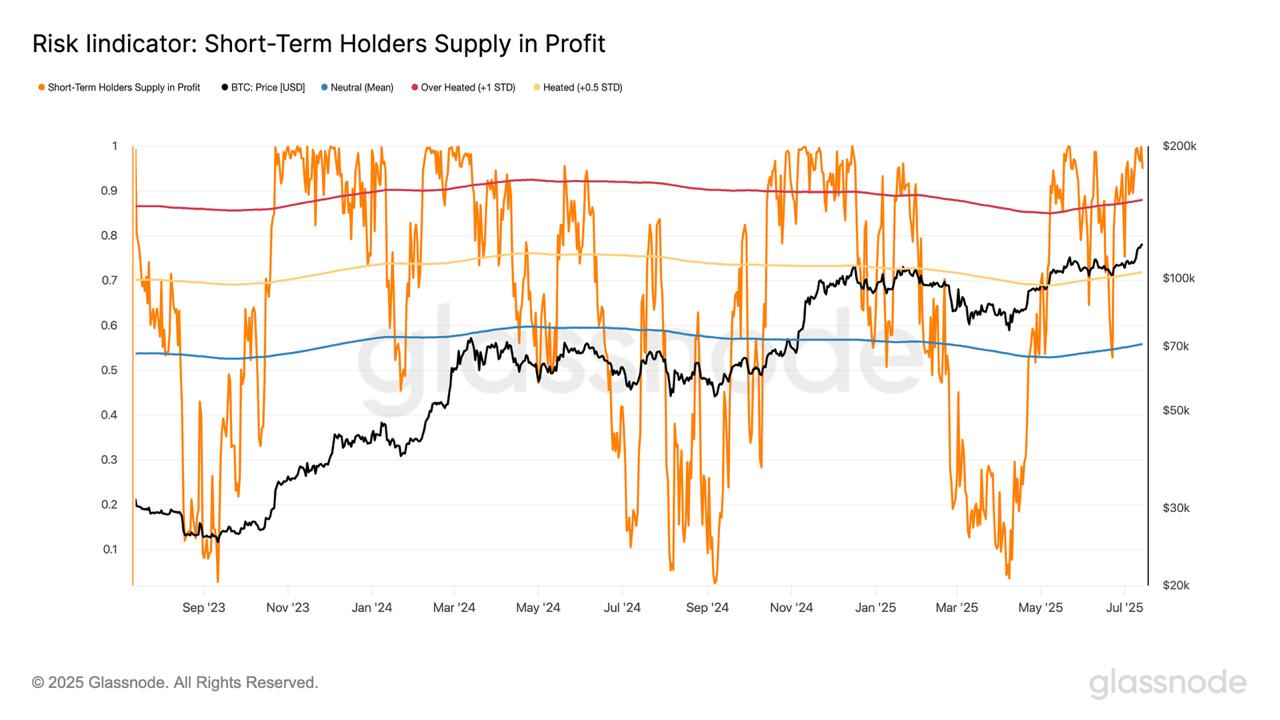
While Bitcoin is still not overheated from the perspective of the STH Cost Basis model, other indicators paint a different picture. The STH Supply In Profit , an indicator tracking the percentage of the cohort’s supply that’s sitting on some gain, has recently surged far above the 88% threshold that has separated high-risk euphoric phases.
Another metric, measuring the percentage of STH volume that’s leading to profit realization, also similarly saw a jump significantly above the historical overheated cutoff of 62%.
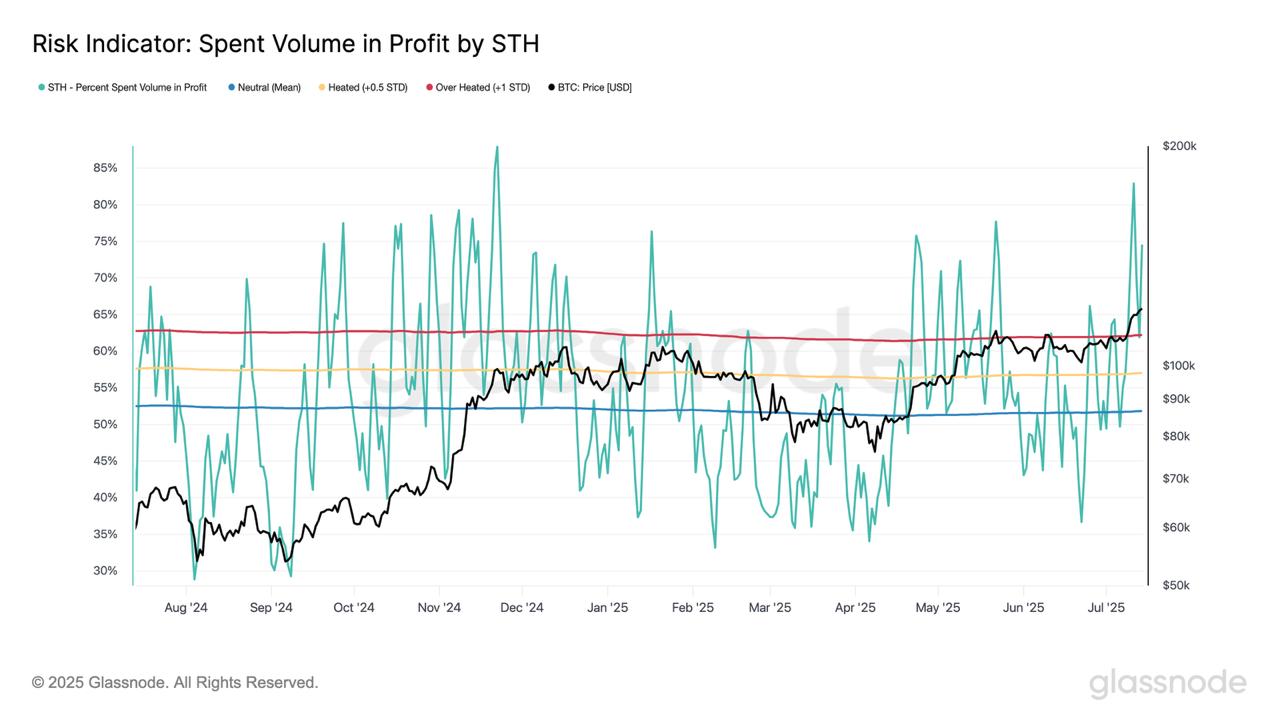
“Such spikes often occur multiple times in bull markets, but repeated signals at these levels typically precede local tops and warrant caution,” notes the analytics firm.
During this spike of profit-taking, the ratio between the profit and loss being realized by the Bitcoin STHs spiked to a 7-day exponential moving average (EMA) value of 39.8.
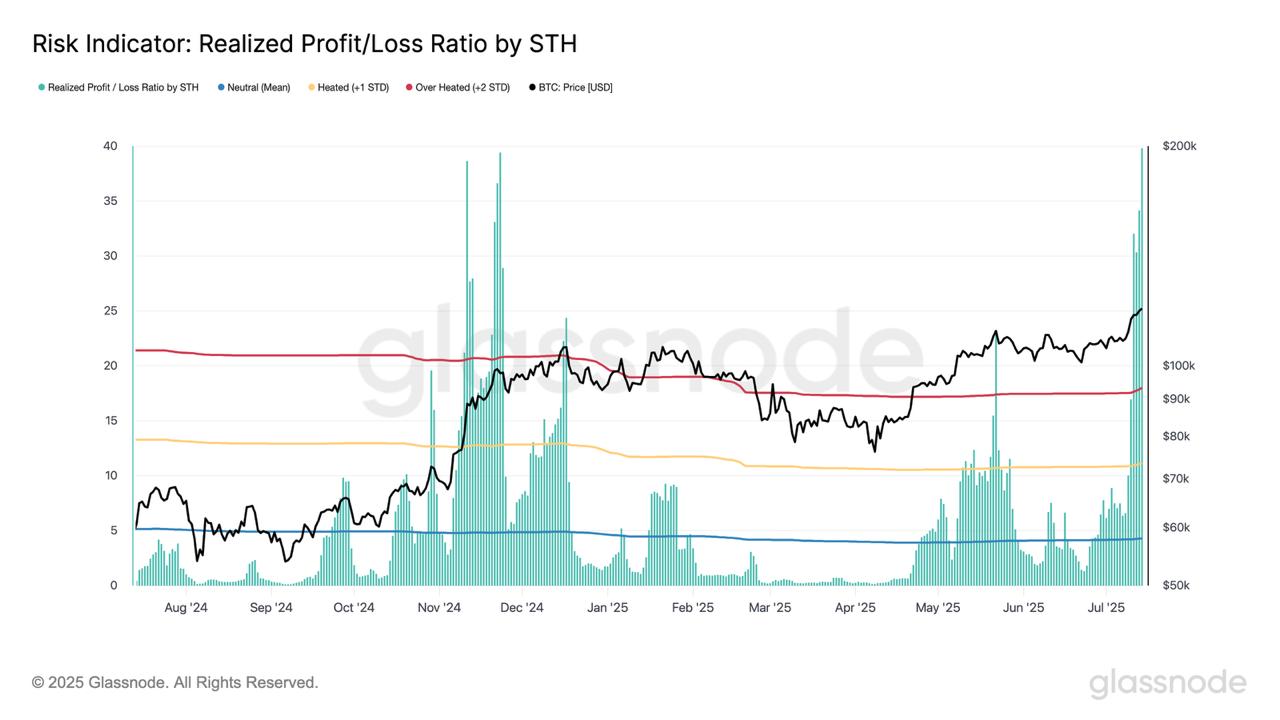
This is a value that’s, once again, extreme by historical standards. That said, spikes like this have generally occurred multiple times over the course of a cycle, before a top is finally attained.
“Historically, cycle tops follow with a lag, leaving room for further upside,” says Glassnode. “However, risk is elevated and the market becomes increasingly sensitive to external shocks. The current pullback aligns with this pattern.”
BTC Price
At the time of writing, Bitcoin is floating around $118,800, up more than 8% in the last seven days.

Bitcoin Set To Soar? Analyst Sees Fresh $2 Billion Liquidity Triggering Next Leg Up
Bitcoin (BTC) is currently stabilizing within the $116,000 to $120,000 range. However, fresh liquidi...
Ethereum Price Breaks Out: Smashes $3,400 Mark in Bullish Run
Ethereum price started a fresh increase above the $3,220 zone. ETH is now consolidating gains and mi...
Bitcoin Recovers to $119K But Key Indicators Show Mixed Signals
Bitcoin has begun to recover after a brief decline triggered by the latest US Consumer Price Index (...