Bitcoin CBD Heatmap Marks $95,500–$97,000 As Make-Or-Break Zone – Details


Since hitting a new all-time high almost a month ago, Bitcoin has done little to assure investors of intent to explore new price territories. Amid announcement of new US trade tariffs and rising geopolitical tensions between Israel and Iran , the premier cryptocurrency has come under bearish influences to trade as low as 101,000.
At press time, Bitcoin is hovering near $104,000 following a 2.03% % decline in the past day. However, popular analytics company Glassnode has highlighted a crucial price range worth monitoring especially in the advent of a further price decline.
Related Reading: Bitcoin Sees Modest Gains, But Demand Weakness Limits Breakout Potential
$95,500–$97,000: Bitcoin’s Line In The Sand
In a recent X post , Glassnode shares an insight into the Bitcoin market based on data from Cost Basis Distribution (CBD) heatmap. The CBD is a common on-chain metric that tracks the price levels at which tokens were last purchased or sold. When a substantial amount of coins are traded within a specific price range, it forms a supply cluster capable of acting as a support or resistance level.
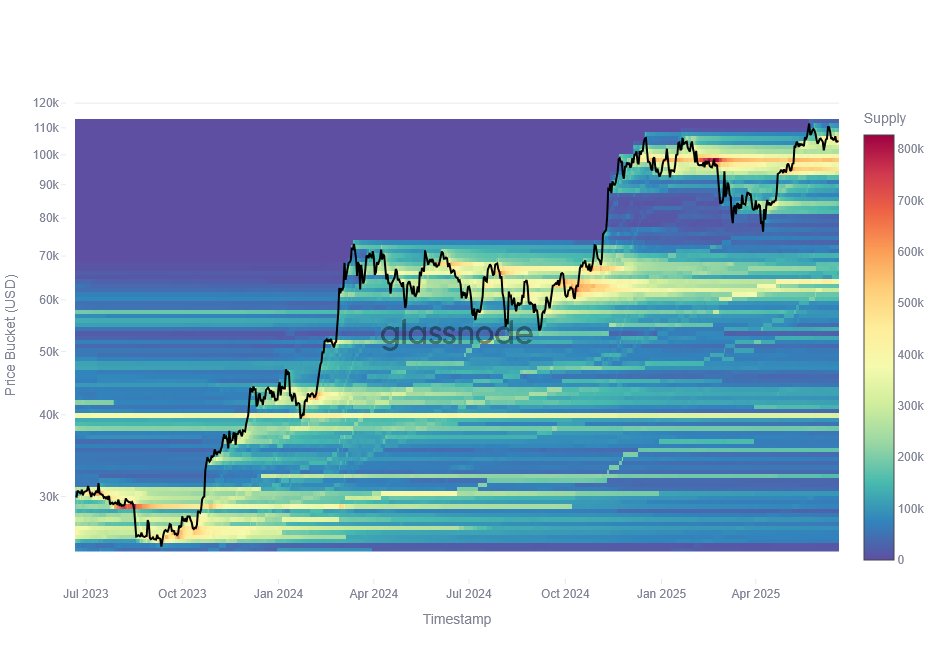
According to Glassnode’s report, the Bitcoin’s CBD heatmap shows the first dense supply cluster below the current market price lies at $95,500 – $97,000 price zone. Interestingly, this range rests just below the short-term holders (STH) cost basis suggesting a confluence of technical and on-chain metric to present a high-stake battleground. Therefore, Glassnode analysts explain that holding the market price above this threshold reinforces bullish momentum and boosts Bitcoin chances of re-entering a price discovery mode. However, a breakdown below the $95,500 price level could trigger panic selling supporting bearish projections for the mid-term to short-term. Interestingly, prominent market analysts including anonymous X expert with username Mr. Wall Street has backed the latter scenario stating Bitcoin is due for a further price drops. Mr. Wall Street strictly warns Bitcoin would not hold above the $100,000 psychological support zone forecasting a price fall to around the $93,000 – $95,000 which Glassnode predicts should induce widescale market liquidations.
Bitcoin Market Overview
At the time of writing, Bitcoin is trading at $103,753 with a cumulative 1.27% decline in the past week. During this period, the flagship cryptocurrency remained largely under $106,000 barring a weak price breakout between June 16 and June 17. On a monthly scale, Bitcoin has now recorded a 6.10% loss, signaling a gradual shift in momentum with bearish forces regaining control of the market. Meanwhile, with a market cap of $2.05 trillion, the “digital gold” continues to rank as the largest cryptocurrency with a reported market dominance of 64.3%.

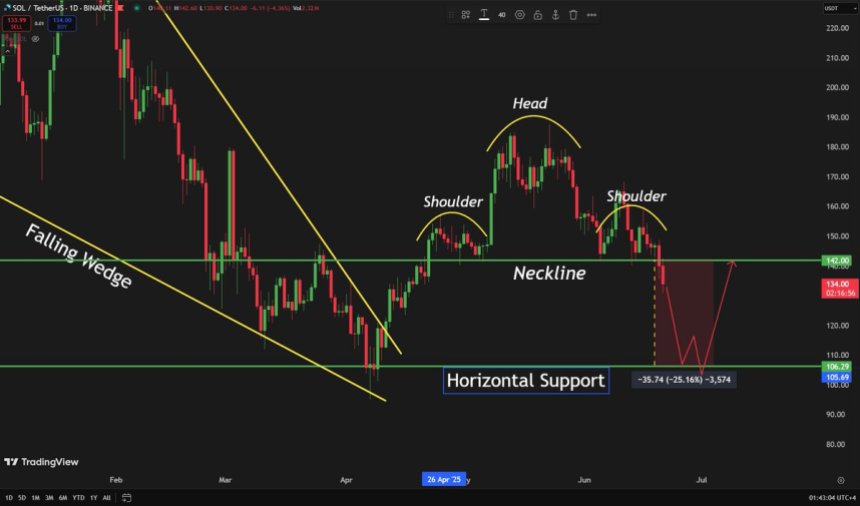
Solana Cracks Below Key Structure – Head And Shoulders Breakdown Points To $106
Solana has broken down decisively, losing a critical support level following news that the United St...
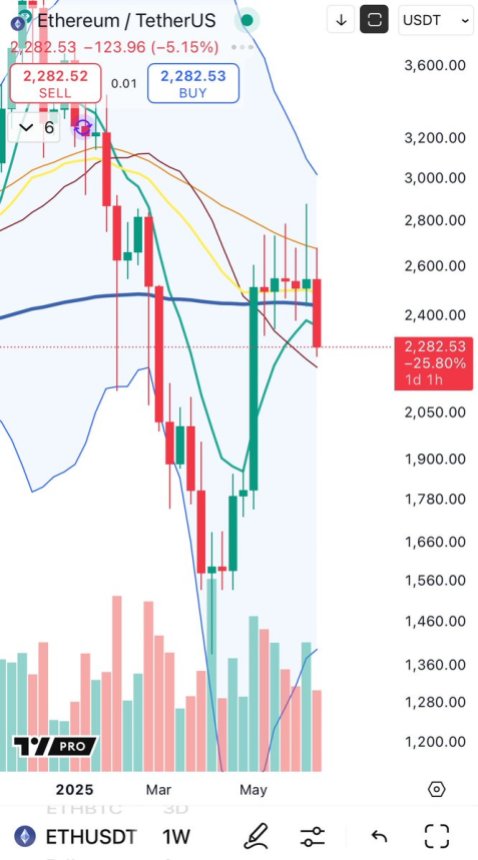
Ethereum Weekly Chart Nears Tower Top Formation As US Launches Attack On Iran – Details
Ethereum has officially broken below the long-standing range it had maintained since early May, losi...

Pump.fun’s Big Launch Put On Ice Over Legal Drama
Pump.fun’s latest delay has rattled its backers. The Solana‐based memecoin launchpad was set to rais...